
Decoding Indian Banking Networks: Why Traditional ML Fails Strategy Analysis
Performance of Pattern Recognition Algorithms in Identifying Banking Networks
This study investigates the strategic expansion patterns of 228 Indian banks using machine learning techniques. It proposes a "narrative approach" combining correlation matrices and heat-maps to outperform traditional K-means and K-nearest neighbor (KNN) algorithms in identifying geographical branching strategies across nine banking groups.
TL;DR
This research tackles the complex problem of identifying branching patterns in the Indian banking sector. While traditional machine learning (ML) models like K-means underperform due to the nuanced nature of institutional strategies, the author proposes a narrative-based correlation approach. This method successfully identifies that while public banks prioritize rural expansion, private banks focus heavily on urban centers, providing a clearer strategic "DNA" of the industry.
Problem & Motivation: The "Blind Spot" of Standard Clustering
For decades, bank branching was viewed through the lens of regulation or geographic diversification. However, in modern economies, branching is a signal of a bank's internal strategy—whether they are chasing profit optimization or fulfilling social mandates.
The author points out a major technical hurdle: standard pattern recognition algorithms often fail when applied to these socio-economic datasets.
- K-means tends to create a "mega-cluster" where 90% of data pointlessly resides.
- KNN struggles with the categorical and temporal nature of branch expansion. The core insight is that geography is not just a coordinate; it’s a strategic choice. To see the pattern, we need a method that measures how "synchronized" different banks are in their expansion timing.
Methodology: Moving from Points to Patterns
The study utilizes data from 228 banks across 9 groups between 2005 and 2017. The breakthrough isn't a more complex neural network, but a more intelligent data pipeline:
- Regional Sorting: Branches are grouped by Rural, Semi-urban, Urban, and Metropolitan areas.
- Year-Matrix Construction: Instead of treating every branch as an independent point, the author constructs 36 matrices comparing groups across time.
- Significance Testing: Rather than just clustering, the paper calculates a correlation matrix and uses T-values to prove which banks are actually following each other's lead.
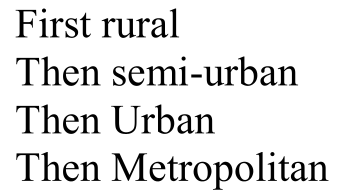 The algorithm uses a structured narrative flow: sorting by region, matrix binding, and correlation assessment.
Experiments & Results: The "Urban-Rural" Divergence
The experimental evaluation proved the author's hypothesis: standard ML was statistically "correct" but practically "useless."
- The Clustering Failure: The
NbClustanalysis (Table 2) suggested 2 clusters as optimal, but this resulted in a lack of granularity. The first cluster absorbed almost all observations, offering no strategic insight. - The Narrative Success: By using Heat-maps and Correlations, the study found that 40% of banks coordinate their rural strategies (often due to RBI mandates), but in urban areas, the correlation drops to less than 1%. This indicates a "free-for-all" competitive landscape in cities.
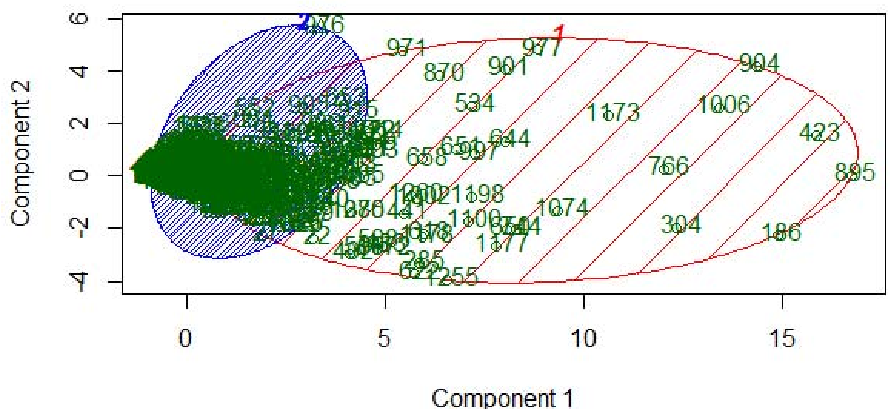 Figure 1: Even though 93.44% of variation is explained by two clusters, it masks the vital strategic differences between individual banking groups.
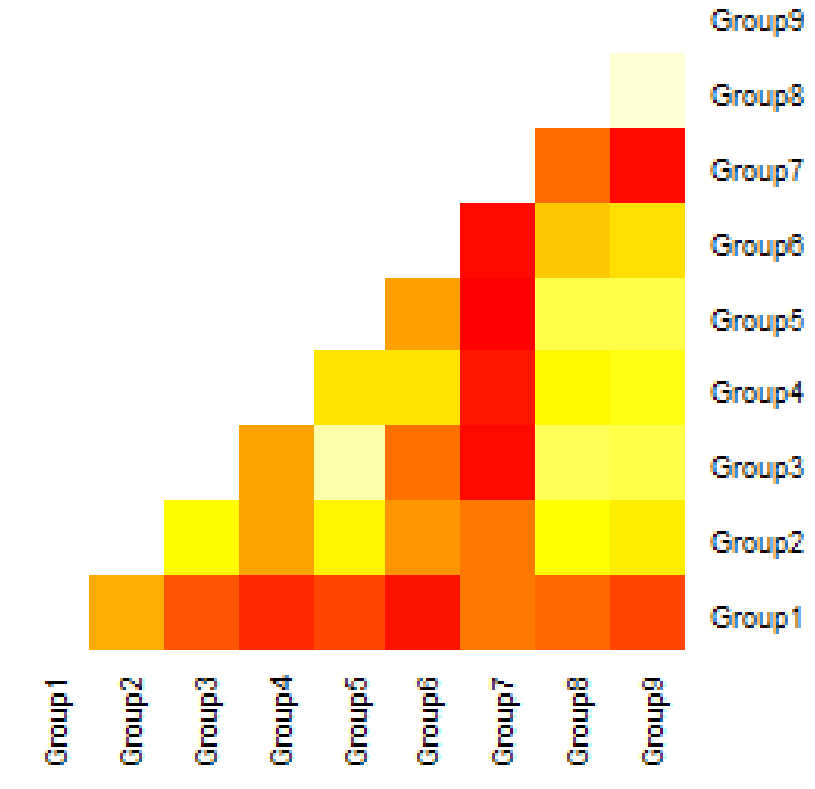 Figure 2 & 3: Visualizing the Light Shades (high concentration) shows Nationalized banks peaking in 2013-14 rural areas, while Private banks maintain a persistent urban focus.
Critical Analysis & Conclusion
Takeaway
The paper successfully demonstrates that in specialized domains like finance and geography, Expert-Guided Feature Engineering and Narrative Visualization are superior to generic unsupervised learning. It provides a roadmap for regulators to see which banks are following the spirit of financial inclusion and which are merely optimizing for short-term urban gains.
Limitations
The study relies heavily on historical correlation. Correlation does not imply causation—a bank might open a branch in a rural area because of a competitor's move, or simply because of a specific government subsidy not captured in this dataset.
Future Outlook
The logical next step is to integrate Spatial-Temporal Neural Networks to predict where the next banking hub will emerge based on the "Narrative" patterns identified here.