
Smartwatch vs. Professional Sensors: Predictive Modeling for Personalized Thermal Comfort
Personal Thermal Perception Models using Skin Temperatures and HR/HRV Features -Comparison of Smartwatch and Professional Measurement Devices
This paper presents a Machine Learning (ML) approach to predict individual thermal sensation and comfort using physiological data from wearable devices. By comparing a consumer-grade smartwatch (Empatica E4) with professional medical sensors (RespiBAN), the study achieves classification accuracies of up to 83.1% using the Extra Tree classifier and introduces a "Combined Thermal Sensation and Comfort (cTSC)" index.
TL;DR
This study investigates whether your smartwatch is enough to tell a smart thermostat how you actually feel. By comparing professional-grade sensors with wearable smartwatches, the researchers developed ML models capable of detecting cold-induced discomfort with ~80% accuracy. The secret sauce? Distal skin temperature and a new combined metric (cTSC) that merges sensation and comfort into one reliable thermal "truth."
Background: Beyond the Average Person
For decades, HVAC systems have relied on the Predicted Mean Vote (PMV) model. The problem? PMV describes the "average" person, but "average" people don't exist. Personal Thermal Comfort (PTC) models aim to fix this by using physiological signals—like how fast your heart beats or how cold your wrists are—to adjust the environment to you.
The Core Motivation: Can Wearables Close the Gap?
The researchers identified two major hurdles in current PTC research:
- Hardware Fidelity: Does the noisy data from a smartwatch (using optical sensors) degrade the model significantly compared to a medical ECG?
- Subjective Perception: Is "feeling cold" the same as "feeling uncomfortable"? Often, they aren't, leading to noisy training data.
Methodology: The Multi-Sensor Approach
The study placed 11 subjects in a controlled "hotel-room" lab, gradually dropping the temperature from 24°C to 20°C while they performed quiet office work.
Data Capture
- Chest Belt (CB): Collected high-fidelity ECG and skin temperatures from the chest, wrist, and fingertip.
- Smartwatch (SW): Collected Blood Volume Pulse (BVP) and wrist temperature.
- Environmental Sensors: Tracked air temperature, humidity, and radiant heat.
The cTSC Label
Instead of picking one ground truth, the authors used PCA to create the Combined Thermal Sensation and Comfort (cTSC). This index captures 96% of the variance between feeling "cold" and feeling "uncomfortable," providing a more stable target for Machine Learning.
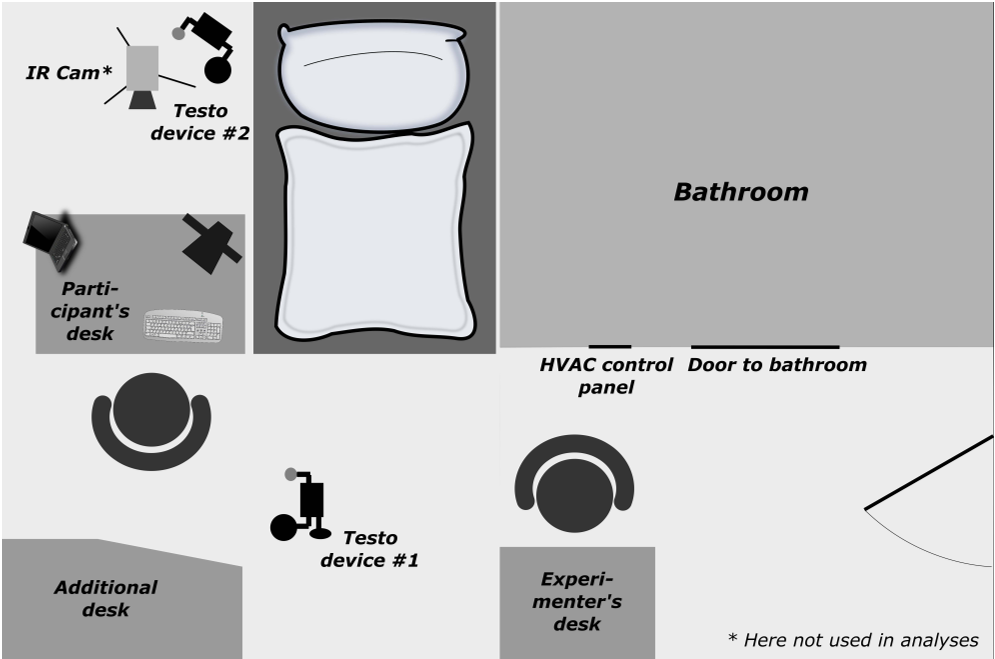 Figure 1: Overview of the test environment and the controlled HVAC setup.
Key Results: What Drives Accuracy?
The study utilized Extra Tree (ET) classifiers, which outperformed SVMs in this specific task.
-
Sensing Device Performance:
- Professional Chest Belt: 83.1% Accuracy
- Smartwatch: 79.8% Accuracy
- The gap (approx. 3%) is surprisingly small, suggesting smartwatches are highly viable for non-clinical comfort management.
-
Predictive Powerhouse: Distal Temperatures: The model's "Feature Importance" analysis showed that the temperature of your extremities (fingertips and wrists) is far more telling than heart rate variability. When you get cold, your body restricts blood flow to the skin to save core heat—a physiological response known as vasoconstriction—which these sensors pick up immediately.
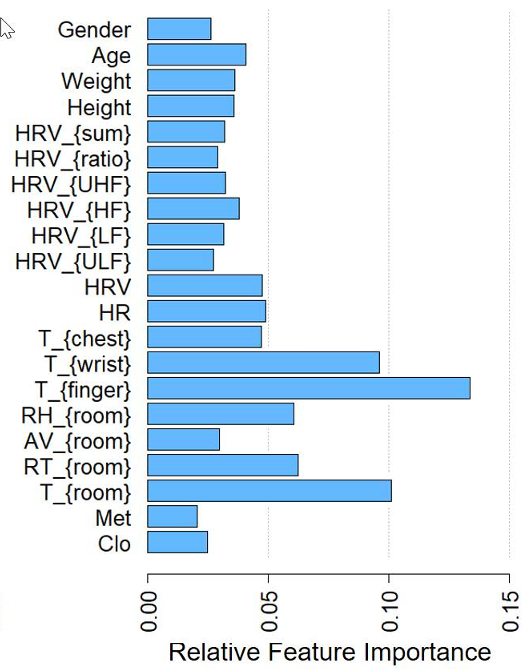 Figure 2: Feature importances showing the dominance of distal skin temperature (Fingertip T) over HR/HRV features.
- The HRV Mystery: Unlike some previous studies, Heart Rate Variability (HRV) had a lower impact here. The researchers suggest this is because the temperature range (20-24°C) wasn't extreme enough to trigger a massive autonomic nervous system shift, or that individual differences (age, weight) masked the signal.
Critical Insight: The Temporal Challenge
Watching the model's predictions over time reveals that thermal comfort isn't a smooth slider; it fluctuates. Models that used only environmental data tended to "jump" erratically between comfort levels. Adding skin temperature smoothed these predictions, making the system more reliable for real-world IoT applications.
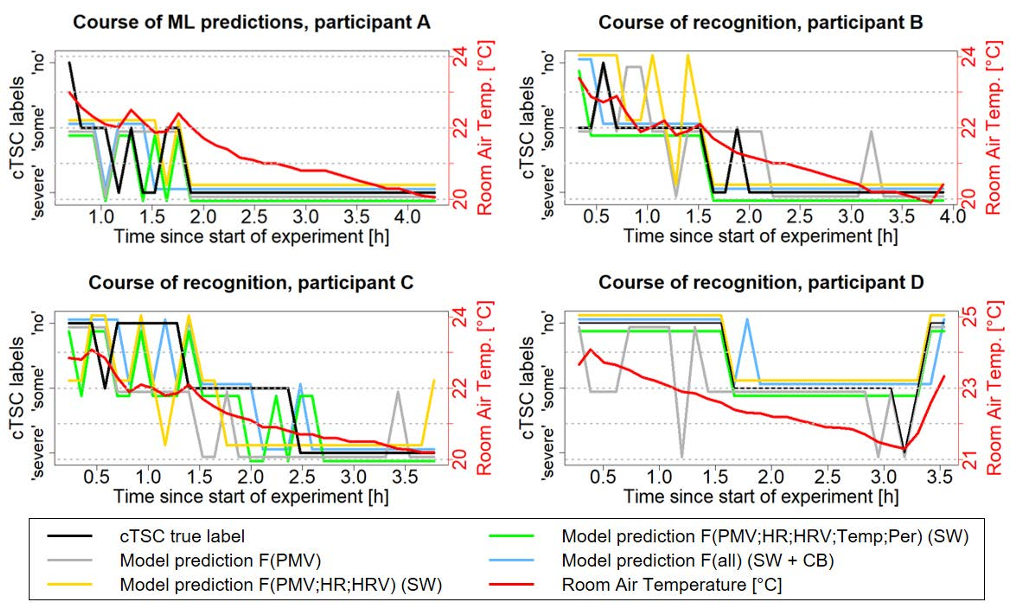 Figure 3: Time-course of predictions vs. ground truth (cTSC). Physiological data (bottom rows) provides much higher stability.
Conclusion & Future Outlook
This work proves that a simple smartwatch can serve as an effective "personal thermostat sensor." While HRV features are less reliable in mild conditions, distal skin temperature is the "gold standard" for personalization.
Future Directions:
- Smart Rings: Since fingertips are even more sensitive than wrists, smart rings might outperform smartwatches for thermal sensing.
- Temporal Modeling: Future models should use LSTMs or Transformers to account for the "history" of a person's temperature, rather than just the current moment.
Ultimately, this research moves us closer to buildings that "feel" what we feel, optimizing for both human well-being and energy efficiency.