
SimRa: Quantifying the Invisible Risks of Urban Cycling
Pervasive and mobile computing
SimRa is a smartphone-based crowdsourcing platform designed to identify "near miss" bicycle incident hotspots. Using GPS and accelerometer data, the system detects dangerous traffic situations and ranks urban locations via a dedicated scoring model, currently deployed across several European cities like Berlin and Bern.
TL;DR
SimRa is an innovative crowdsourcing platform that turns smartphones into black boxes for cyclists. By capturing GPS and acceleration data, it identifies "near miss" hotspots—those dangerous moments where a crash almost happened. Unlike official police records that only track actual blood and broken glass, SimRa maps the "perceived danger" of city streets to help planners fix death traps before they become statistics.
The Data Gap: Why "No Accidents" Doesn't Mean "Safe"
In car-centric city planning, safety is often measured by the absence of reported crashes. However, this is a dangerous fallacy. For every one reported accident, there are hundreds of near-misses—sudden swerves to avoid a car door, hard braking for a vehicle pulling out, or terrifying "close passes."
The authors of SimRa argue that waiting for accidents to reach "statistical significance" is morally unacceptable. Furthermore, current crowdsourced maps (like Strava) are biased toward recreational athletes rather than daily commuters, and they lack the granularity to explain why a street is scary.
Methodology: From Raw Sensors to Danger Scores
The SimRa platform consists of a mobile app (Android/iOS) and a sophisticated analytical backend.
1. Data Acquisition & Detection
The app samples data at high frequencies:
- Accelerometer (50Hz): Detects sudden peaks in motion.
- GPS (3-second intervals): Maps the route.
- Heuristic Detection: Since potholes can mimic accidents, the system looks for "acceleration spikes" within 3-second windows, identifying the most likely incidents for the user to review.
2. The Scoring Model
A street with 10 incidents might seem dangerous, but if 10,000 people ride there, it might be safer than a quiet street with 5 incidents and only 10 riders. SimRa introduces a Dangerousness Score:
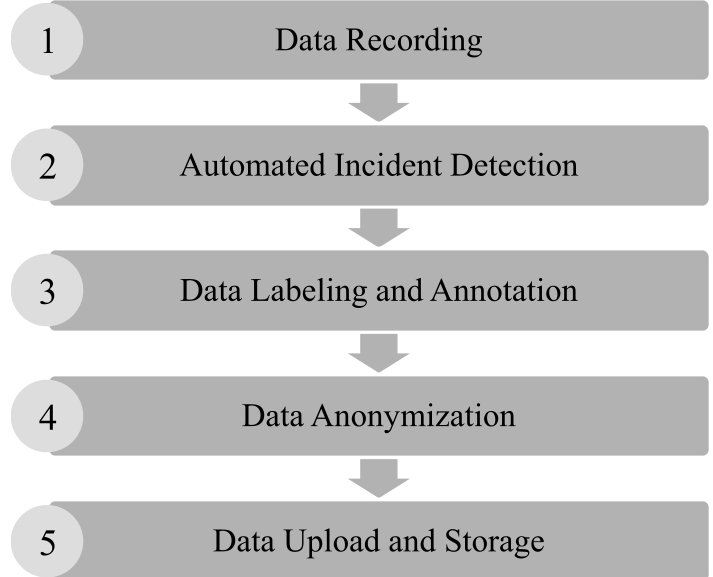 Above: The 5-step data acquisition process from recording to backend upload.
The core scoring formula is: Where:
- r = Number of rides (the denominator of exposure).
- s/n = Number of "Scary" vs "Non-scary" incidents.
- α = Severity factor (weighted at 4.4 based on cyclist surveys).
Validation: Putting Berlin Under the Microscope
The researchers evaluated three specific Berlin streets to test if the scores matched reality:
| Street Segment | Rides | Incident Score (Adjusted) | Infrastructure Context |
|---|---|---|---|
| Edisonstraße | 79 | 57.35 | High Danger: Tram tracks + second-row parking. |
| Paulsborner Straße | 184 | 3.22 | Moderate: Narrow lanes causing "illegal" close passes. |
| Leibnizstraße | 194 | 2.46 | Safe: Separated bike lanes and low traffic. |
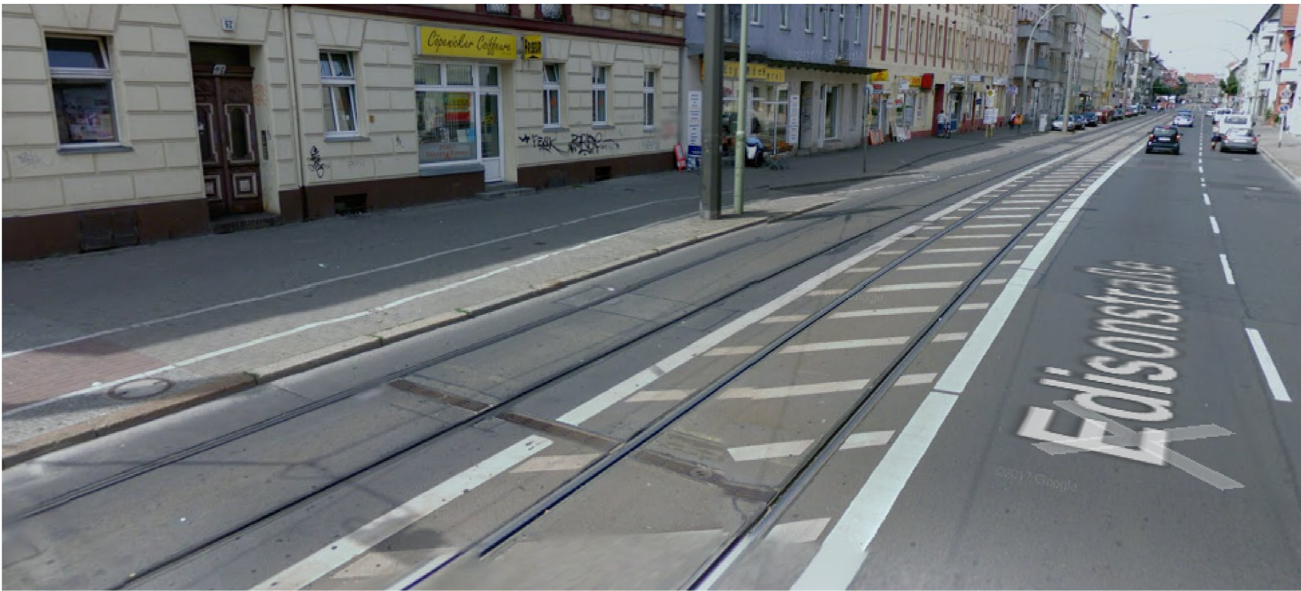 The dangerous environment of Edisonstraße, where cyclists must merge into tram tracks due to illegally parked cars.
Critical Analysis & Future Outlook
The primary strength of SimRa is its scalability. By avoiding expensive hardware (like ultrasonic distance sensors), it can be deployed in any city globally.
Limitations:
- Detection Bias: Sudden braking is easy to sense; "close passes" (where the cyclist doesn't move but is terrified) are invisible to accelerometers. These still rely on manual user tagging.
- User Demographics: The project currently attracts tech-savvy "citizen scientists," potentially underrepresenting senior citizens or children.
Conclusion
SimRa proves that the "subjective" feeling of safety can be turned into "objective" data for engineers. By identifying hotspots like Edisonstraße, the platform provides the evidence needed to justify removing parking spaces or adding physical barriers—transforming urban spaces from car-tunnels into livable, bikeable environments.
For more technical details, the SimRa project maintains its findings and open-source code as part of a continuing effort to improve bicycle safety through data.