
Decoding Social Dynamics: Detecting Leaders and Followers via Mobile Sensing
Pervasive and mobile computing
The paper introduces a novel framework for detecting following and group leadership patterns among pedestrians using mobile sensing data (WiFi signal strength and acceleration). By employing Time-Lagged Similarity Features and machine learning, the authors achieve State-of-the-Art performance in complex indoor environments, reducing error rates to as low as 7%.
TL;DR
Researchers from Aarhus University have developed a way to identify who is following whom in a crowd using nothing but the WiFi signals in your pocket. By analyzing the "echo" of movement patterns through time-lagged similarity metrics, their system can pinpoint group leaders in complex, multi-story buildings where GPS fails, achieving a remarkable 93% accuracy.
The Challenge: Why Indoor Following is Hard
In the world of "Reality Mining," understanding how humans group and interact is the holy grail for retail marketing and emergency response. However, existing methods have hit a wall:
- GPS Limitations: It doesn't work indoors or distinguish between floors.
- Computer Vision: Cameras are expensive, raise privacy issues, and suffer from "occlusions" (people blocking each other).
- Geometric Failures: Standard models assume that if I'm behind you, I'm following you. But in a crowded mall or a winding staircase, the "follower" might be on a different level or around a corner.
The authors argue that the key isn't where you are, but when you reached the same signal state.
Methodology: The "Temporal Echo"
The core innovation lies in Time-Lagged Similarity Features. Imagine two people, P1 and P2. If P1 is leading, P1 will encounter a specific WiFi signal strength (RSSI) from a nearby router first. Seconds later, the follower (P2) will encounter that same signal pattern.
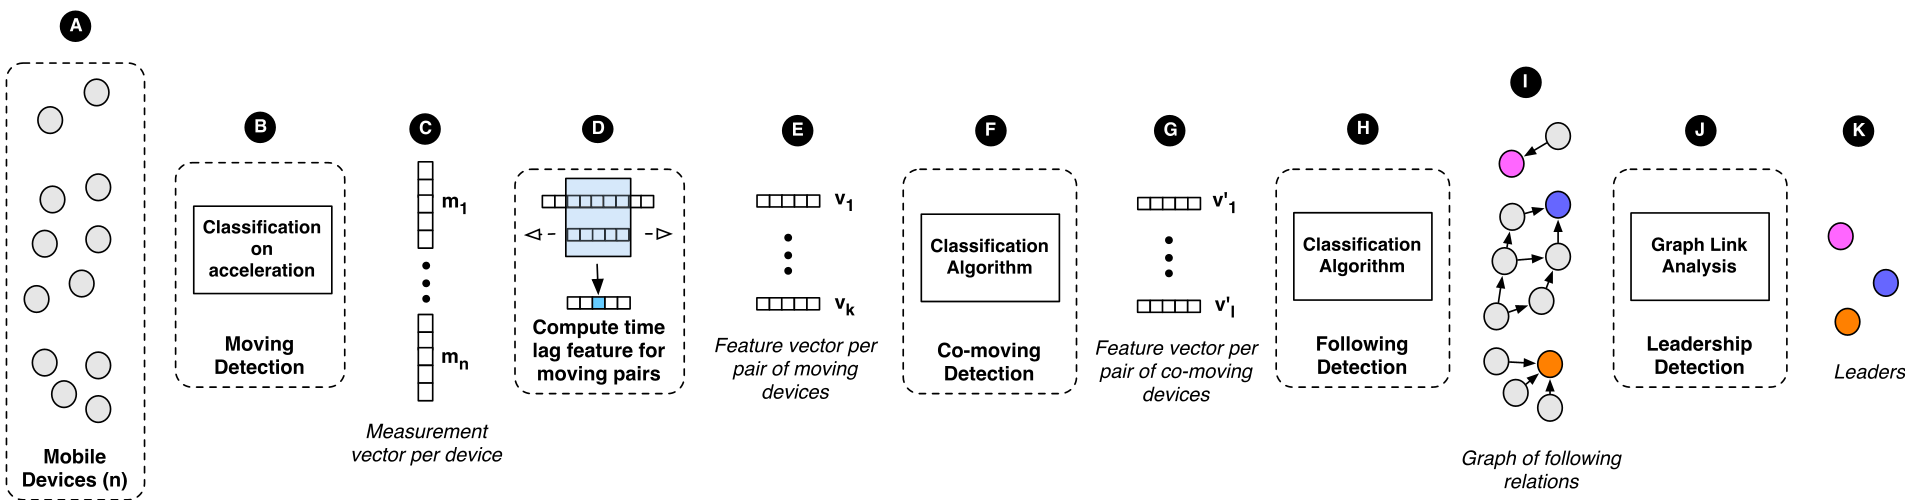
1. The Architecture
The system follows a multi-stage pipeline to transform raw sensor pings into social insights:
2. Following via Dynamic Time Warping (DTW)
Unlike simple correlation, Dynamic Time Warping allows for "squashing" or "stretching" time. If a follower slows down to look at a shop window but then speeds up to catch the leader, DTW can still align their movement signatures. The "lag" () that produces the highest similarity tells us who is leading () and who is following ().
3. Leadership as a Graph Problem
Once pairwise following is established, the authors build a directed graph.
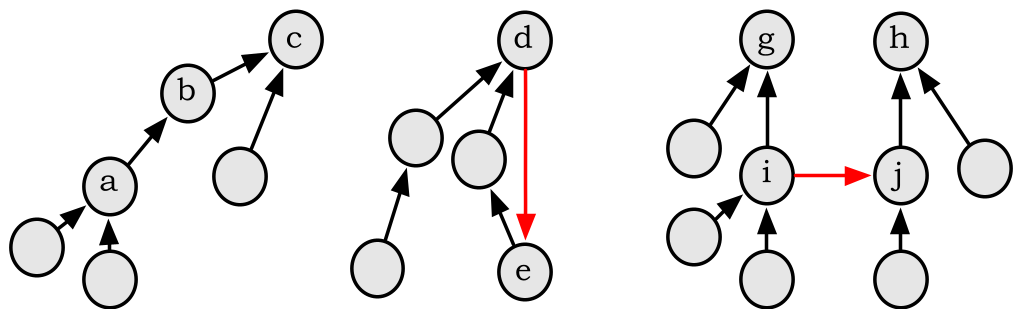 By analyzing link transitivity (if A follows B and B follows C, then C is the ultimate leader), they can identify the "Global Leader" even in noisy data where some links might be misdetected.
Experimental Results: Proving the Instinct
The team tested their theory in two scenarios: a controlled Scripted Office environment and a chaotic "Follower-Evader" Game in a university hall.
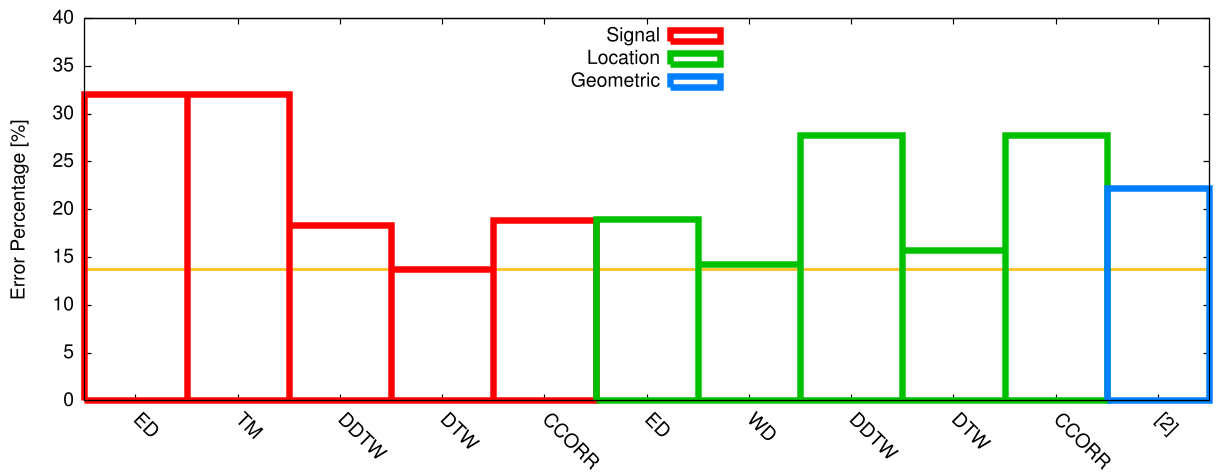
- Accuracy Boost: Using DTW on raw WiFi signals was more accurate than using calculated (X, Y) coordinates. This is because location "fingerprinting" often introduces errors that the raw signal avoids.
- The SOTA Killer: They compared their work against the classic geometric algorithms (Andersson et al.). Their method reduced leadership detection errors by a massive 20%.
Deep Insight: Signal vs. Location
One of the most profound takeaways is that raw signal data is often a better proxy for social behavior than processed location data. When we map signals to coordinates, we lose the "texture" of the environment. The chaotic fluctuations of WiFi in a multi-story building—usually seen as "noise"—actually act as a unique "signature" that makes matching leaders to followers easier.
Conclusion and Future Outlook
This work transforms the mobile phone from a simple communication tool into a "sociometric badge."
The Business Impact:
- Retail: Identifying which family member leads the group to a specific aisle.
- Public Safety: Analyzing whether police or rescue teams followed their designated leadership protocols during high-stress training.
- Gaming: Enabling massive, building-wide "tag" or "spy" games without manual judging.
While the computational cost currently scales quadratically with the number of people (), future optimizations in dimensionality reduction could make this a standard feature in smart building management within the decade.