
PPG & Machine Learning: Breaking the Cuff in Hypertension Risk Stratification
Photoplethysmography and Machine Learning for the Hypertension Risk Stratification
This paper presents a comprehensive study on hypertension risk stratification using Photoplethysmography (PPG) signals and a wide array of Machine Learning (ML) algorithms. Utilizing the Cuff-Less Blood Pressure Estimation Data Set, the authors compare 17 different ML techniques across three granularity levels, achieving high discrimination performance with Random Forest and Naive Bayes architectures.
TL;DR
Hypertension is the "silent killer" of cardiovascular health. This study moves beyond traditional, uncomfortable blood pressure cuffs by leveraging Photoplethysmography (PPG)—the same tech in your smartwatch—combined with a massive benchmarking of 17 Machine Learning models. The results? A near-perfect detection of hypertension (F-score: 0.994) and a robust framework for identifying early-stage risk.
Context: Why the Cuff Fails
For over a century, the sphygmomanometer has been the gold standard. But it has two fatal flaws:
- Invasiveness: It requires physical compression, which is uncomfortable for long-term monitoring.
- Psychological Bias: The "White Coat Phenomenon" causes patients to show higher BP in clinics than at home, leading to misdiagnosis.
The authors argue that PPG—a low-cost, wearable-friendly optical method—is the key to continuous, home-based monitoring. The real challenge, however, isn't just measuring BP, but Risk Stratification: accurately placing a patient in the correct medical bin (Normotension, Pre-hypertension, or Hypertension).
Methodology: High-Granularity Stratification
The researchers didn't just treat this as a simple classification problem. They used the Cuff-Less Blood Pressure Estimation Data Set (derived from MIMIC II) to create a dataset of 526,906 signal segments.
The core of their evaluation lies in three "Granularity Levels":
- Level 1: Normotension vs. Pre-hypertension (The "Early Warning" stage).
- Level 2: Normotension vs. Hypertension (The "Direct Diagnosis" stage).
- Level 3: [Normotension + Pre-hypertension] vs. Hypertension (The "Clinical Intervention" threshold).
 The data processing pipeline transforms 125Hz PPG samples into a high-dimensional feature vector paired with invasive ABP labels.
Comparing the "Brain Power" of 17 Algorithms
The study benchmarked a diverse catalog of algorithms, from traditional Bayes Nets to complex MultiLayer Perceptrons and Ensemble methods like Random Forest.
| Algorithm Group | Key Representatives |
|---|---|
| Bayes | Naive Bayes, Bayes Net |
| Functions | Logistic Regression, SVM, MLP |
| Trees | Random Forest, J48 (C4.5) |
| Meta | AdaBoost, Bagging |
The Performance Breakdown
The results confirm that simpler tasks (Normotension vs. Hypertension) are effectively "solved" by even basic probabilistic models. However, as the medical boundary blurs, ensemble methods take the lead.
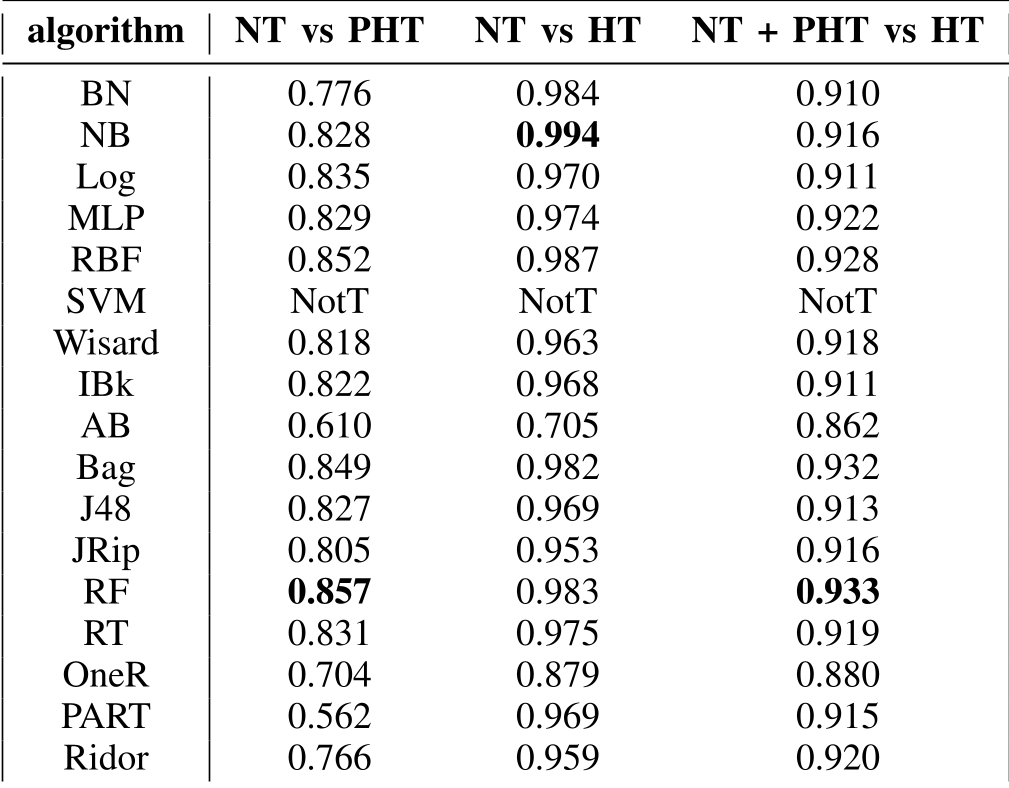 Table III: Risk Stratification Performance. Note the dominance of Random Forest (RF) and Naive Bayes (NB) across different levels.
Deep Insights: The Pre-hypertension Barrier
The experiment revealed a critical medical insight: Pre-hypertension is significantly harder to detect than overt hypertension.
- In Level 2 (Direct Diagnosis), Naive Bayes hit an F-score of 0.994.
- In Level 1 (Early Warning), the best score (Random Forest) dropped to 0.857.
Why? The physiological signal of a pre-hypertensive subject often fluctuates and shares a high degree of "feature overlap" with healthy subjects. The confusion matrices showed that nearly 45% of pre-hypertensive events were misclassified as normotensive. This suggests that while ML is great at spotting someone who is already ill, "predictive" early-stage detection still requires more sophisticated feature extraction or longitudinal data.
Critical Analysis & Conclusion
This paper serves as a vital benchmark. It proves that Random Forest is currently the most reliable "all-rounder" for PPG analysis, likely due to its ability to handle the non-linearities and high dimensionality of raw signal windows.
Limitations:
- The dataset is highly unbalanced (Normotension items far outnumber Stage 2 items), which can bias models toward the majority class.
- The study used "default parameters" for all models to save time; hyperparameter optimization could likely push these F-scores even higher.
Future Outlook: The next frontier isn't just better algorithms, but better data. Integrating ECG (Electrocardiogram) with PPG could provide "Pulse Transit Time" (PTT) metrics, potentially solving the Pre-hypertension classification bottleneck. Wearables are close to becoming medical-grade diagnostic tools, and this study provides the algorithmic roadmap to get there.