
Beyond Gazing: Using Physiological Heatmaps to Visualize the Emotional Heart of UI
Physiological heatmaps: a tool for visualizing users’ emotional reactions
This paper introduces "Physiological Heatmaps," a novel visualization tool for Human-Computer Interaction (HCI) that maps users’ emotional and cognitive states onto interface elements by combining eyetracking data with physiological signals (EDA, Pupil Size, EEG). The method effectively identifies emotionally significant regions that standard gaze heatmaps often overlook.
TL;DR
Researchers have developed a way to "see" what a user feels while interacting with a website. By syncing eyetracking with physiological sensors like heart rate and pupil dilation, Physiological Heatmaps reveal which parts of an interface cause stress, excitement, or boredom—even if the user only glances at them for a split second.
The "Why" Behind the Gaze: The Motivation
In the world of UX research, Gaze Heatmaps are the gold standard. They tell us exactly where users look. However, they suffer from a major limitation: Ambiguity. A user might stare at a block of text because it is fascinating, or simply because it is difficult to read. Conversely, a critical "Add to Cart" button or a customer rating might elicit a strong emotional spike but go unnoticed in a gaze heatmap because it was processed quickly.
The authors argue that physiological data (EDA, EEG, Pupil Size) provides the "Why" to the eyetracker's "Where." By bridging these two, we can identify "Affective Saliency"—the emotional weight of an interface.
Methodology: Mapping Emotions to Pixels
The transition from a gaze heatmap to a physiological one isn't just a simple swap of data. It involves solving the Signal Asynchronicity problem.
1. The Multi-Resolution Window
Unlike light hitting the eye, which is instantaneous, your body's "feeling" response has a delay. Pupil dilation happens quickly, while sweat response (EDA) can take seconds to peak. The authors developed specific extraction windows for each signal, ensuring that when you look at an icon, the heatmap records the reaction to that icon, not the previous one.
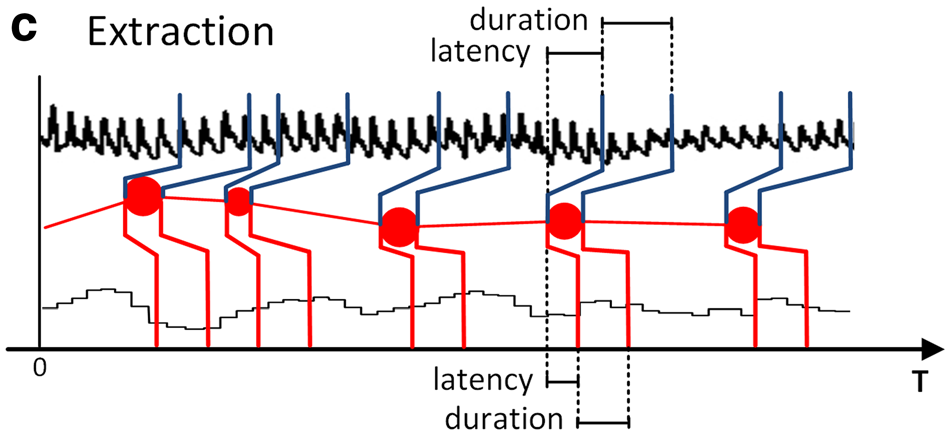
2. Z-Score Normalization
Everyone has different baseline levels of physiological activity. To compare diverse participants, the authors used Z-score normalization. This ensures that only deviations from a user's average state contribute to the "heat," effectively filtering out neutral background noise.
Experimental Results: Where Pupils Beat Gaze
The team tested 44 participants using images from the International Affective Picture System (IAPS).
The results were striking:
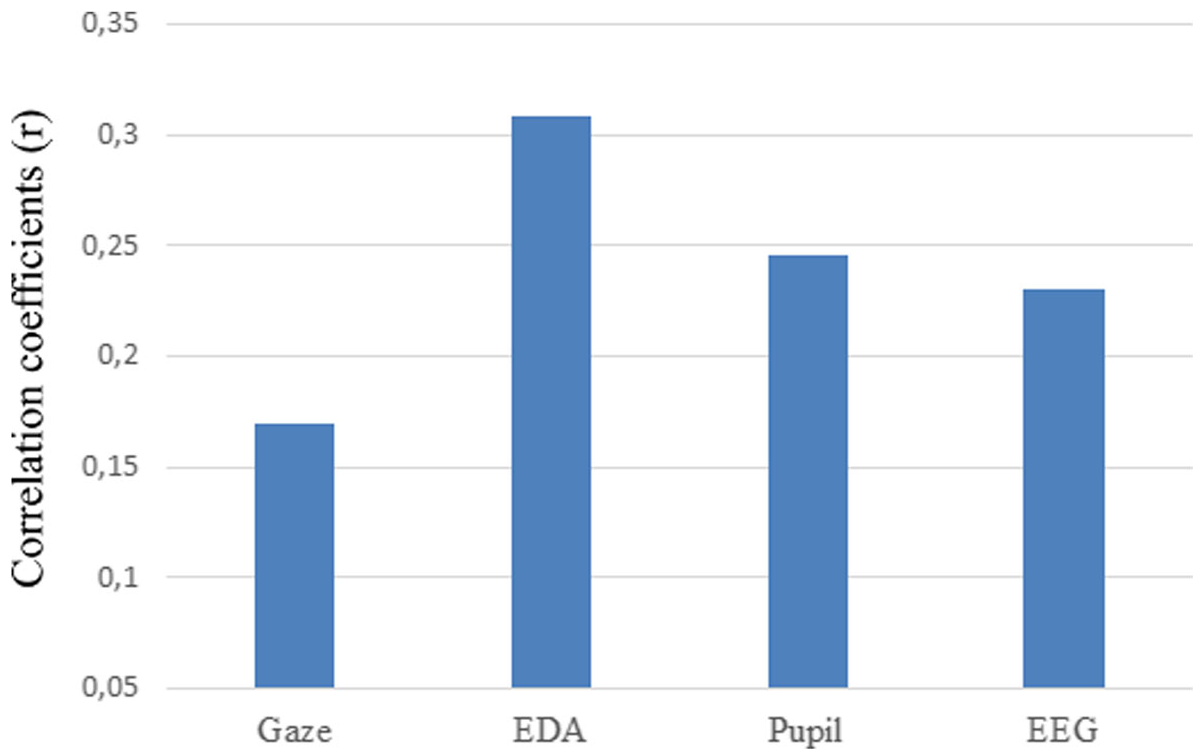
- Higher Accuracy: Physiological heatmaps (especially those using Pupil Size and Electrodermal Activity) correlated much more accurately with validated emotional ratings than standard gaze metrics.
- Scalability: When the interface became "emotionally dense" (many intense images close together), Pupil Size-based heatmaps remained the most reliable due to the pupil's high temporal resolution.
Deep Insight: Gaze vs. Arousal in the Real World
The paper concludes with a brilliant real-world use case: a social networking page for a hotel.
- Gaze Heatmap: Showed users focused mostly on long blocks of text (comments).
- Physiological Heatmap: Revealed a massive "hotspot" on the Star Ratings.
This proves that while users spent time reading, their emotional decision-making was driven by the star rating—a transient glance that a traditional UX study might have completely undervalued.
Critical Analysis & Future Outlook
Takeaway: This work represents a shift from "Behavioral UX" to "Affective UX." It provides a generic framework that doesn't rely on specific app logs, making it applicable to any interface from mobile apps to airplane cockpits.
Limitations: The primary challenge remains the "Carryover Effect." If a user sees something shocking, their physiology may stay elevated while they look at the next three neutral items. While the authors' windowing helps, low-temporal signals like skin conductance still struggle with "emotional density."
Future Work: Combining these overlapping heatmaps using multivariate color blending (e.g., merging Valence and Arousal to show "Excitement" vs. "Frustration") could provide the first truly literal map of user sentiment.