
Poking Facebook: Why Reach is Not Just About Installation Numbers
Poking facebook: characterization of osn applications
The paper provides a pioneering measurement-based characterization of third-party applications on Facebook (OSN). Utilizing datasets from Facebook analytics (Adonomics) and direct profile crawling of 300K users, it reveals highly skewed popularity distributions and proposes a "preferential installation" model to simulate user-application bipartite graphs.
TL;DR
In this seminal 2008 study from UC Irvine, researchers "poked" the underbelly of the Facebook Application Platform. By analyzing 170 days of analytics and 300K user profiles, they discovered that while the Facebook "Gold Rush" saw a linear explosion of app installations, user attention actually plateaued and declined. They successfully modeled this behavior using a "preferential installation" mechanism, providing a tool to predict user coverage for advertisers.
The "Attention Gap": Growth vs. Engagement
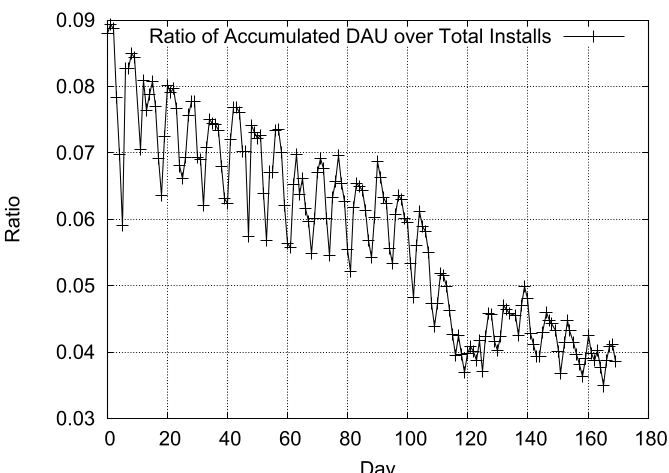
The core motivation of the study was a paradox: Facebook was adding thousands of apps and millions of installations, but was the audience actually using them?
The authors identified a critical "Attention Gap." As shown in the aggregate data, while the "Total Installations" curve climbed steadily, the "Daily Active Users" (DAU) curve hit a ceiling. This meant that newer apps weren't necessarily bringing in new engagement; they were merely competing for the same finite slice of user time. For a资深 technology leader, this is a classic lesson in Attention Economy: on a platform, engagement is a zero-sum game.
Methodology: Mapping the Bipartite Graph
To understand how apps are distributed among users, the researchers didn't just look at totals; they mapped the connections. They treated the system as a bipartite graph (Users on one side, Applications on the other).
The Preferential Installation Model
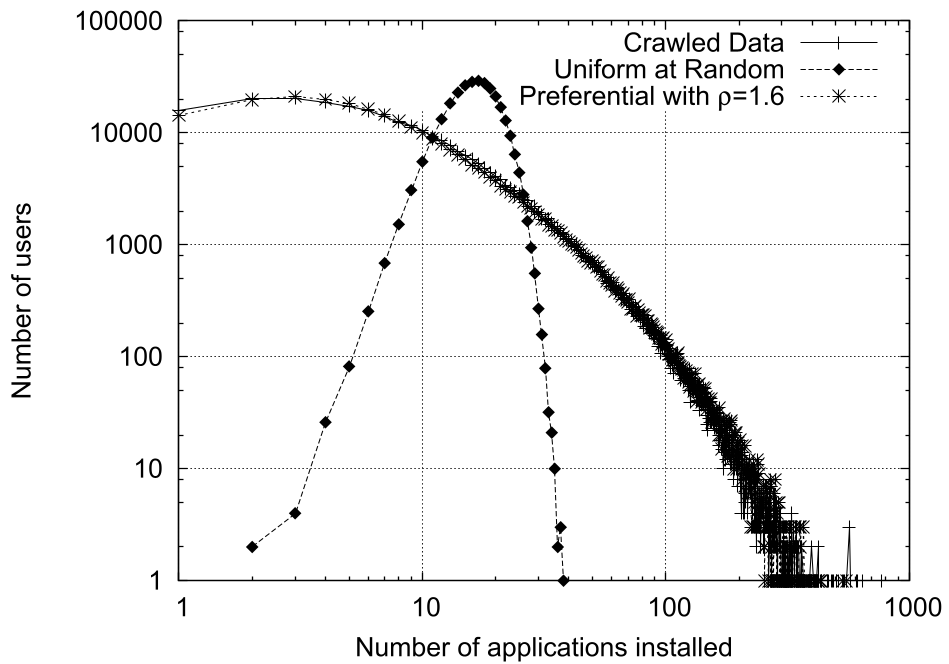
The most technically insightful part of the paper is the simulation of how a user chooses to install an app. They hypothesized that installation is not a random act but follows a Preferential Installation logic. The probability of a user installing a new app is defined as:
Where acts as an acceleration factor. By setting , the simulation's results perfectly mirrored real-world crawled data. This proves that "power users" (those who already have many apps) are significantly more likely to adopt new ones, creating a highly skewed distribution where 10% of apps account for 98% of all installations.
Category Winners: Who Survived the Hype?
The study categorized apps into "Friend Comparison," "Gestures," "Gifting," etc.
- Winners: "Casual Communication" and "Friend Comparison" apps (like Super Wall) showed the most viral growth because they tapped into core social utilities.
- Losers: "Gestures" (like the infamous "Vampire/Zombie" bites) saw an early spike but quickly faded as users moved from "amusement" to "annoyance."
Experiments & Results: Validating User Coverage
The simulation didn't just look good in theory; it worked for business. When the authors used their model to predict the "User Coverage" (the unique number of users reached by owning a specific set of apps), the simulated results were within ±4% of the truth.
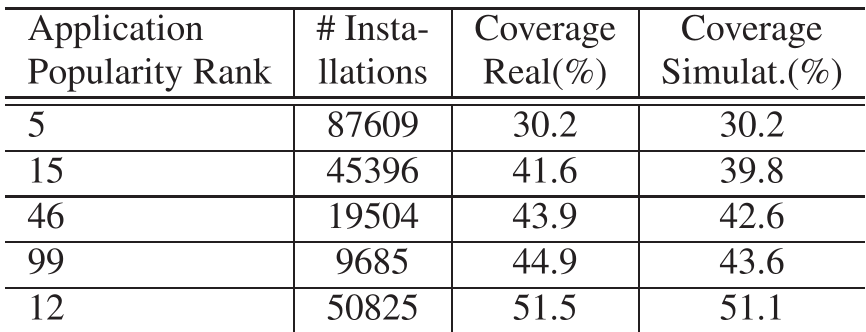
For an advertiser in 2008, this was a "Moneyball" moment: you didn't need to buy the most expensive app to get the most reach; you needed to find the set of apps with the least user overlap—a calculation made possible by this bipartite graph simulation.
Critical Insight & Conclusion
Takeaway
The value of this paper lies in its movement from Observation (apps are popular) to Mechanistic Modeling (apps become popular because of preferential attachment). It reminds us that platform dynamics are governed by mathematical laws of "cumulative advantage."
Limitations
The study’s sampling method (crawling "10 random users") was a bottleneck due to Facebook's anti-crawling measures, potentially missing privacy-conscious users. Furthermore, the model focused on installations, which the authors themselves proved is a "leaky" metric compared to DAU.
Future Outlook
This work laid the foundation for studying Virality Coefficients and social contagion. Today, in the age of TikTok and algorithmic feeds, the "preferential attachment" isn't just driven by user choice, but by AI-driven recommendation—making the mathematical modeling of "Reach" more complex but more vital than ever.