
Precise Population Cost Prediction: Beyond Linear Regression in Healthcare Analytics
Population Cost Prediction on Public Healthcare Datasets
This paper evaluates the efficacy of machine learning algorithms—specifically Regression Trees, M5 Model Trees, and Random Forests—for predicting individual and population-level healthcare costs using public claims (SID) and survey (MEPS) datasets. The study achieves state-of-the-art accuracy in cost prediction across multiple time horizons, notably showing that M5 Model Trees significantly reduce Mean Absolute Error (MAE) compared to traditional linear baselines.
TL;DR
Predicting healthcare costs is notoriously difficult due to "Black Swan" events—a small number of patients incurring massive costs. This paper demonstrates that while Previous Cost is a strong baseline, M5 Model Trees significantly outperform traditional methods, predicting future costs for 75% of the population with pinpoint accuracy (errors under $125 in some scenarios).
The "Zero-Spike" and "Heavy-Tail" Problem
The United States spends $8,508 per capita on healthcare, yet ranks lowest in quality of care among comparable nations. Why is it so hard to predict where the money goes?
Architecturally, healthcare data is a machine learning nightmare:
- The Zero-Spike: Most people don't go to the hospital in a given year (zero cost).
- The Heavy-Tail: A tiny fraction of patients with chronic or acute conditions account for the vast majority of spending.
Standard Multiple Linear Regression (MLR) attempts to fit a single straight line through this chaos. If you have one patient who costs 500.
Methodology: The Power of Piecewise Models
The authors propose a shift from global models to partition-based models. Instead of one formula for everyone, they split the population into smaller, more homogeneous groups.
The Contenders:
- Regression Trees (CART): Splits the data into "buckets" (e.g., Age > 65 AND Has Diabetes) and assigns a flat average cost to that bucket.
- Random Forest (RFR): An ensemble of trees that reduces overfitting by averaging predictions.
- M5 Model Tree: The star of the show. It splits the data like a tree, but instead of a flat value at the end, it fits a local linear regression at every leaf. This allows for a "smooth" yet non-linear fit across the population.
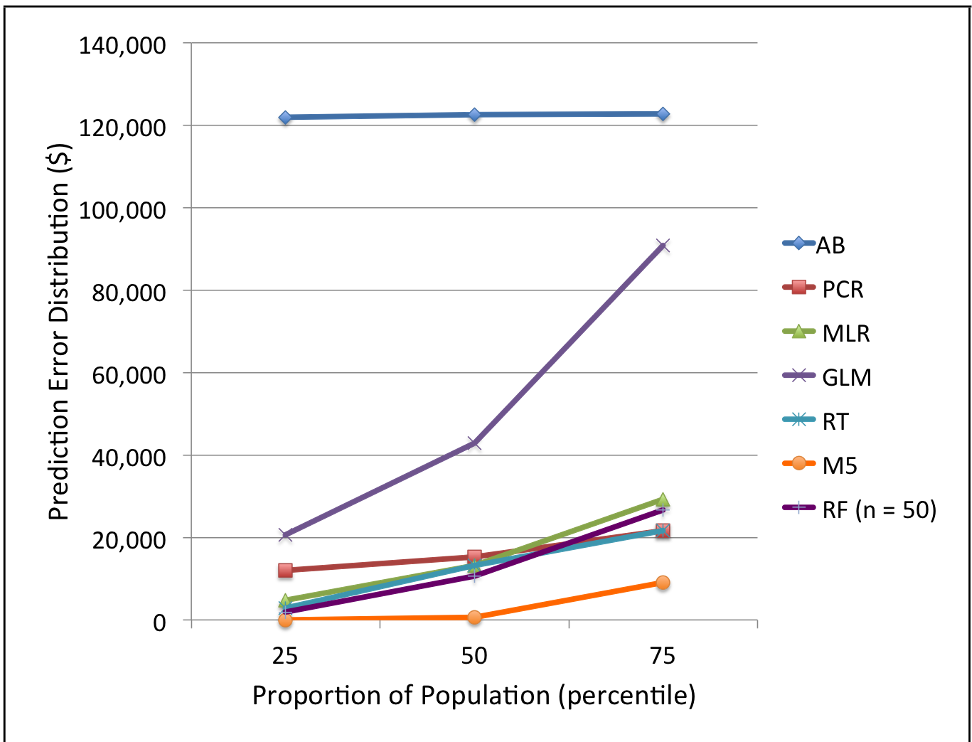 Figure 1: Comparison of error distributions across different models. The M5 Model Tree (dark blue line) consistently stays lower on the Y-axis (Error) for a larger portion of the population.
Experimental Setup: SID vs. MEPS
The study tests these models on two massive, distinct datasets:
- SID (State Inpatient Database): High-accuracy hospital claims data (Focus on expensive inpatient visits).
- MEPS (Medical Expenditure Panel Survey): Self-reported household data (Broad, but noisier).
Key Insights and Results
The researchers tested four scenarios (P1-P4) ranging from 3-month to 12-month forecasts.
1. The M5 Superiority
M5 Model Trees consistently achieved the lowest Mean Absolute Error (MAE). By combining the "sorting" power of trees with the "predictive" power of regression, they captured the nuances of patient history that simple linear models missed.
2. The 75% Threshold
While the Root Mean Square Error (RMSE) remained high (because of those $1M outliers), the models were incredibly accurate for the majority.
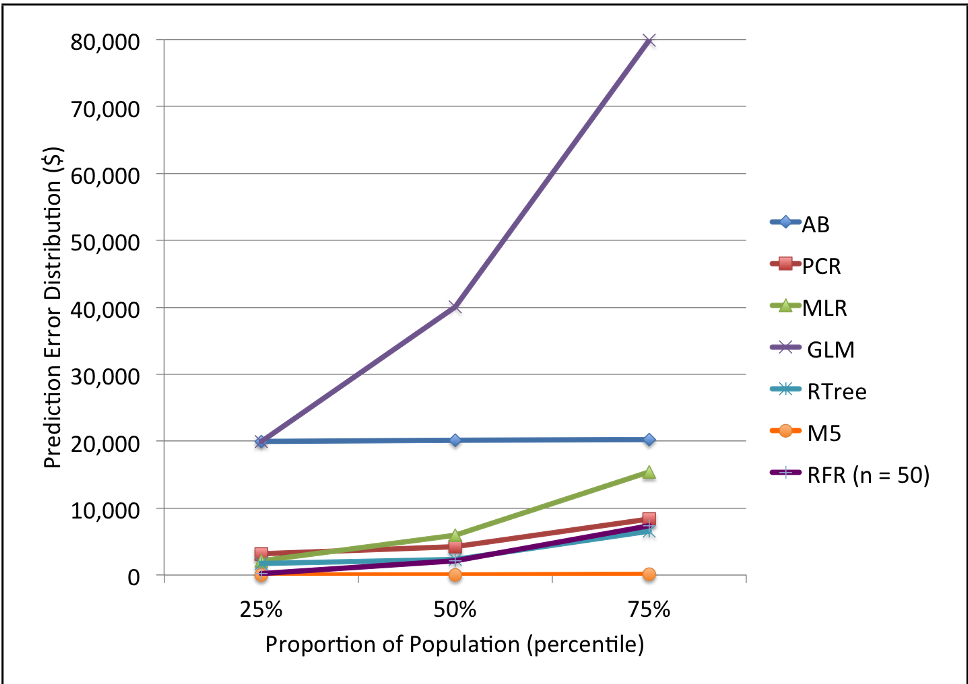 Figure 2: Error distribution in the P2 scenario. Notice how the error stays flat and low for the first 75% of the population before spiking for the outliers.
| Algorithm | scenario | MAE ($) |
|---|---|---|
| M5 Model Tree | P3 (9mo -> 3mo) | $7,647 |
| PCR (Baseline) | P3 (9mo -> 3mo) | $12,710 |
| MLR (Standard) | P3 (9mo -> 3mo) | $18,652 |
Real-World Application: HealthSCOPE
The authors didn't just stop at a paper. They deployed these models into HealthSCOPE (Healthcare Scalable COst Prediction Engine), a tool for insurers and accountale care organizations (ACOs) to visualize population risk.
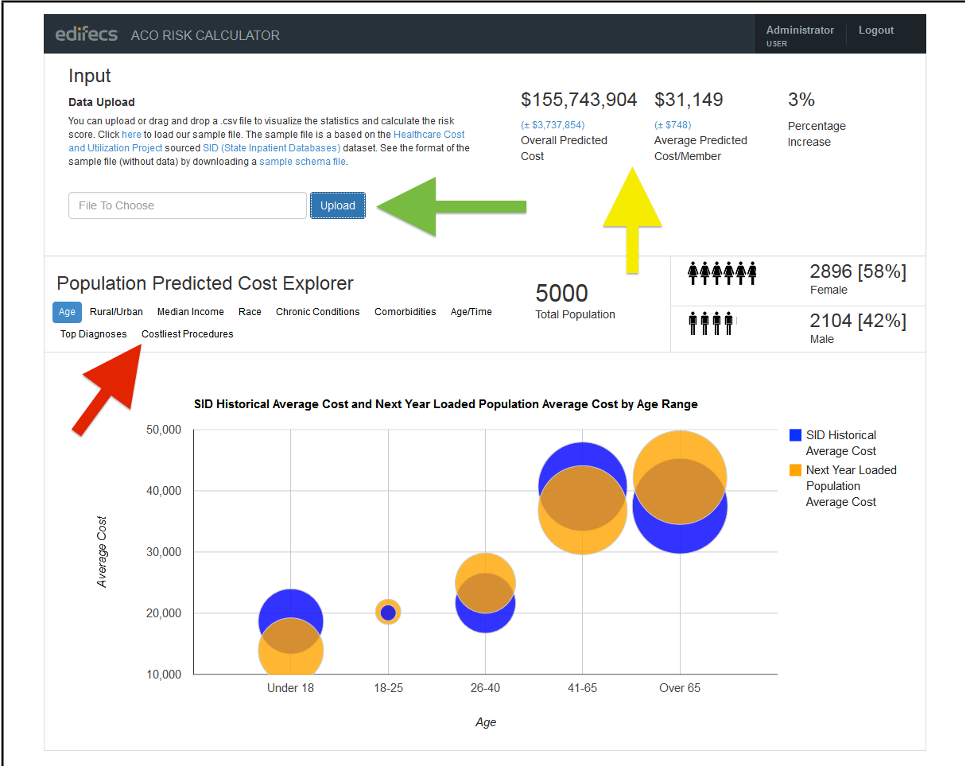 Figure 3: The HealthSCOPE dashboard, allowing users to upload claims data and see projected costs across age groups.
Conclusion and Future Outlook
The study proves that machine learning can tame the "skewed" nature of medical costs for most people. However, the high RMSE values remind us that "Outlier Patients" remain the hardest nut to crack.
Future Direction: The next step in this research involves building dedicated models specifically for high-cost subpopulations, rather than trying to fit one model to the entire spectrum of patients.