
Algorithmic Bias = Population Bias + Structural Bias: Why Geolocation Fails Rural Users
The Effect of Population and Structural Biases on Social Media-based Algorithms - A Case Study in Geolocation Inference Across the Urban-Rural Spectrum
This paper investigates the performance of Twitter geolocation inference algorithms across the urban-rural spectrum. By analyzing both text-based (Priedhorsky et al.) and network-based (Jurgens) methodologies, the authors demonstrate that these algorithms consistently underperform for rural populations, achieving state-of-the-art (SOTA) accuracy primarily for urban users.
TL;DR
Social media algorithms don't just reflect society's biases—they amplify them through their very architecture. This study reveals that popular Twitter geolocation algorithms are significantly more accurate for urban users than rural ones. Crucially, the authors find that even if you give these algorithms "fair" data, they still fail rural users due to Structural Bias—design choices that inherently favor high-density urban environments.
The Background: A Quiet Geographic Divide
We know that social media data is biased. Urban dwellers tweet more frequently, and their data is "on the map" more often than their rural counterparts. While social scientists have learned to weight their samples to account for this, the algorithms we build on this data—recommender systems, trend trackers, and geolocation inferrers—often ignore these disparities.
The authors ask a critical question: If an algorithm is trained on a world that looks mostly like New York City, does it simply ignore the person tweeting from rural Nebraska? And if so, is it because the algorithm doesn't have enough Nebraska data, or because it literally doesn't know how to understand Nebraska?
Methodology: Putting Algorithms to the Test
The researchers audited two distinct paradigms of geolocation inference:
- Text-based (Priedhorsky et al.): Uses Gaussian Mixture Models (GMMs) to link specific words or "tokens" to geographic coordinates.
- Network-based (Jurgens): Mentions-based propagation that assumes you live near the people you interact with.
To isolate the cause of bias, they created four training conditions:
- Typical (Baseline): Raw, urban-heavy Twitter data.
- Population Bias Balanced: Data resampled to match actual US Census urban/rural proportions.
- Urban/Rural Boosted: Models trained exclusively on one population to see the maximum potential performance for that group.
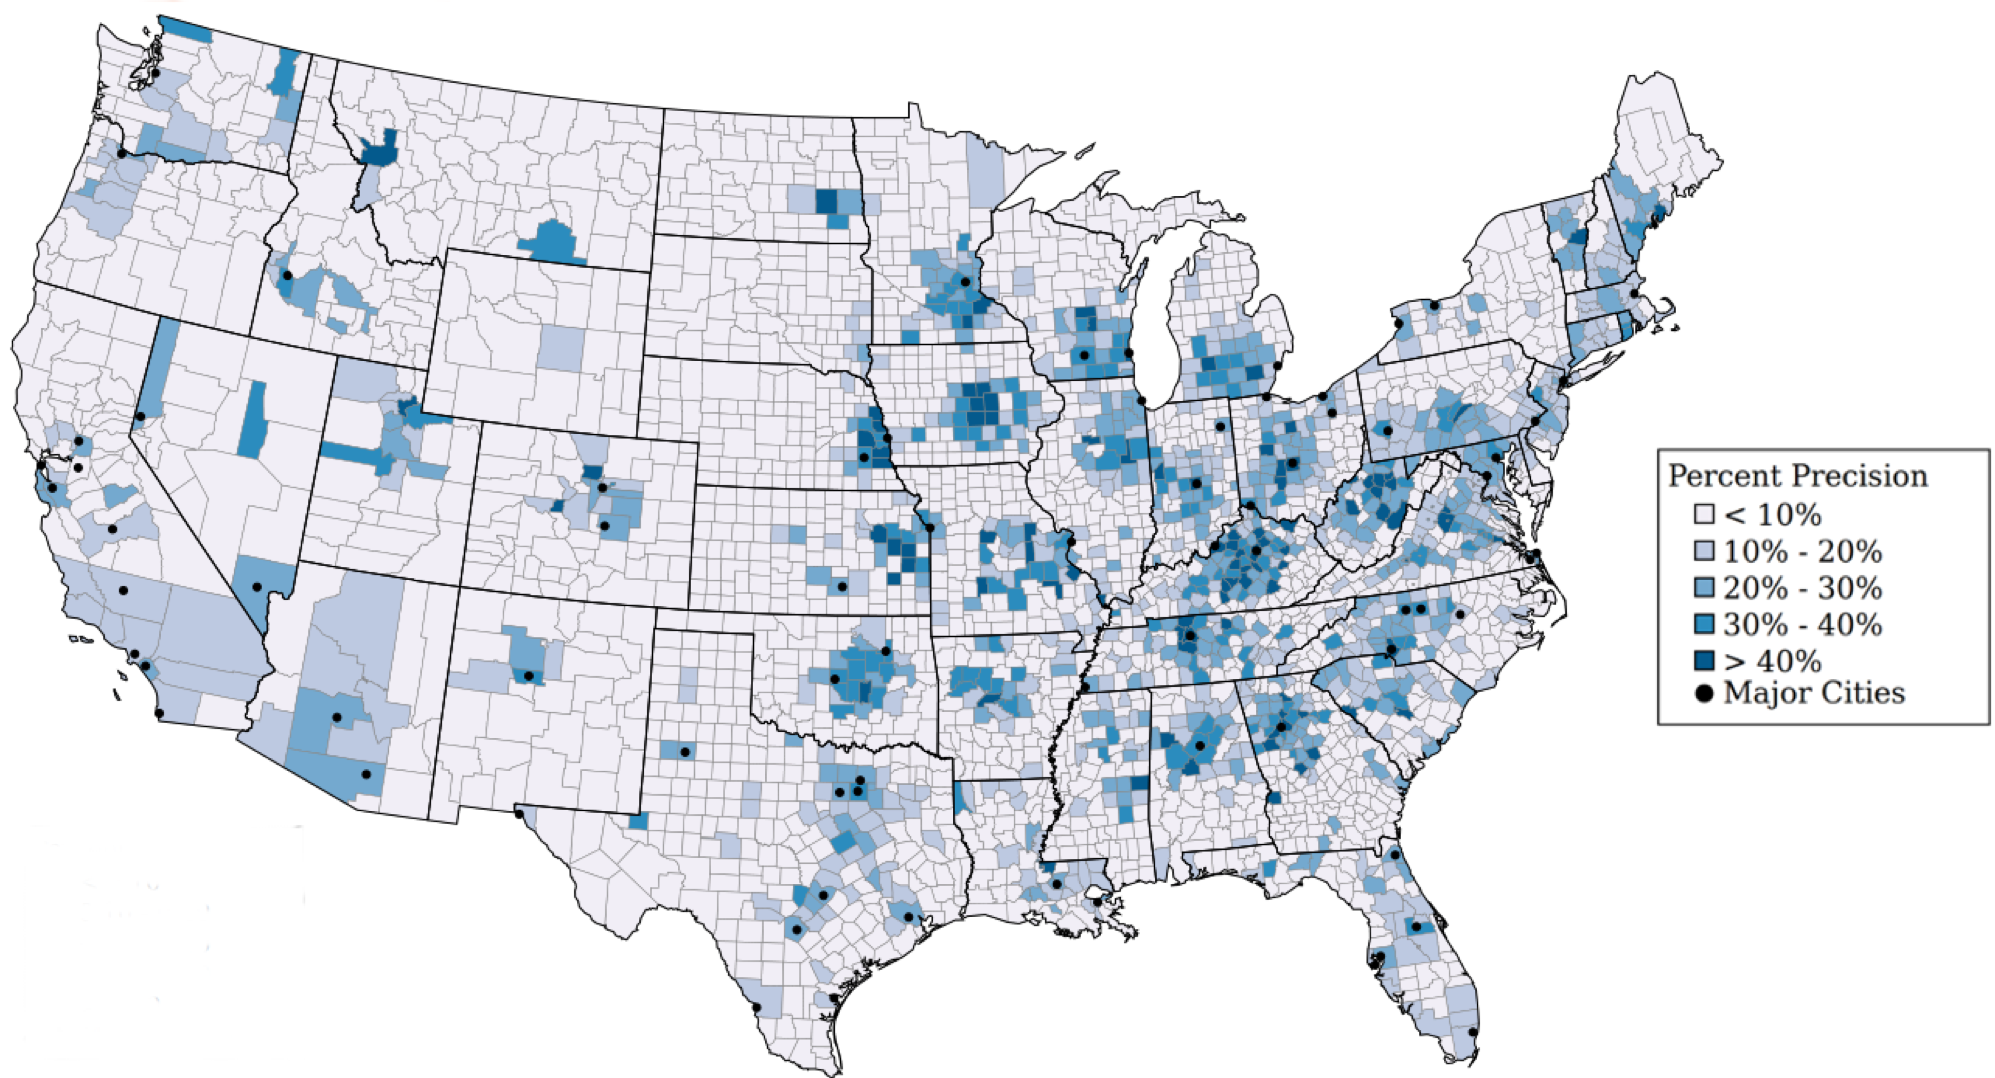 The map above visualizes the "Urban Advantage": High-precision clusters (darker blue) are almost exclusively centered around major metropolitan hubs.
The "Structural Bias" Breakthrough
The most shocking finding came from the "Rural Boosted" experiment. In the text-based model, even when the algorithm was trained only on rural tweets, its precision (17.9%) was still significantly lower than the urban precision in almost any other model (reaching up to 27.6%).
Why does this happen? (The "How")
The authors identify three drivers of Structural Bias:
- Fixed Distance Parameters: Many text-based algorithms use a fixed grid or radius. In a city, a high school mascot name might pin you to a 5-mile radius. In the country, that same mascot might serve a school district covering 50 miles. Using the same "zoom level" for both fails the rural context.
- Lexical Density: Urban tweets contained 25% more "wikifiable" geographic concepts (specific landmarks, neighborhood names) than rural tweets.
- Homophily Differences: Network-based models actually performed better when balanced because social ties in rural areas are highly local (90% same-county homophily). Urban networks are often more dispersed, paradoxically making the network approach a "fairer" tool for rural outreach if the data is balanced.
Results: The Hidden Trade-off
The study highlights a painful reality in algorithmic design: The Trade-off between Equity and Effectiveness.
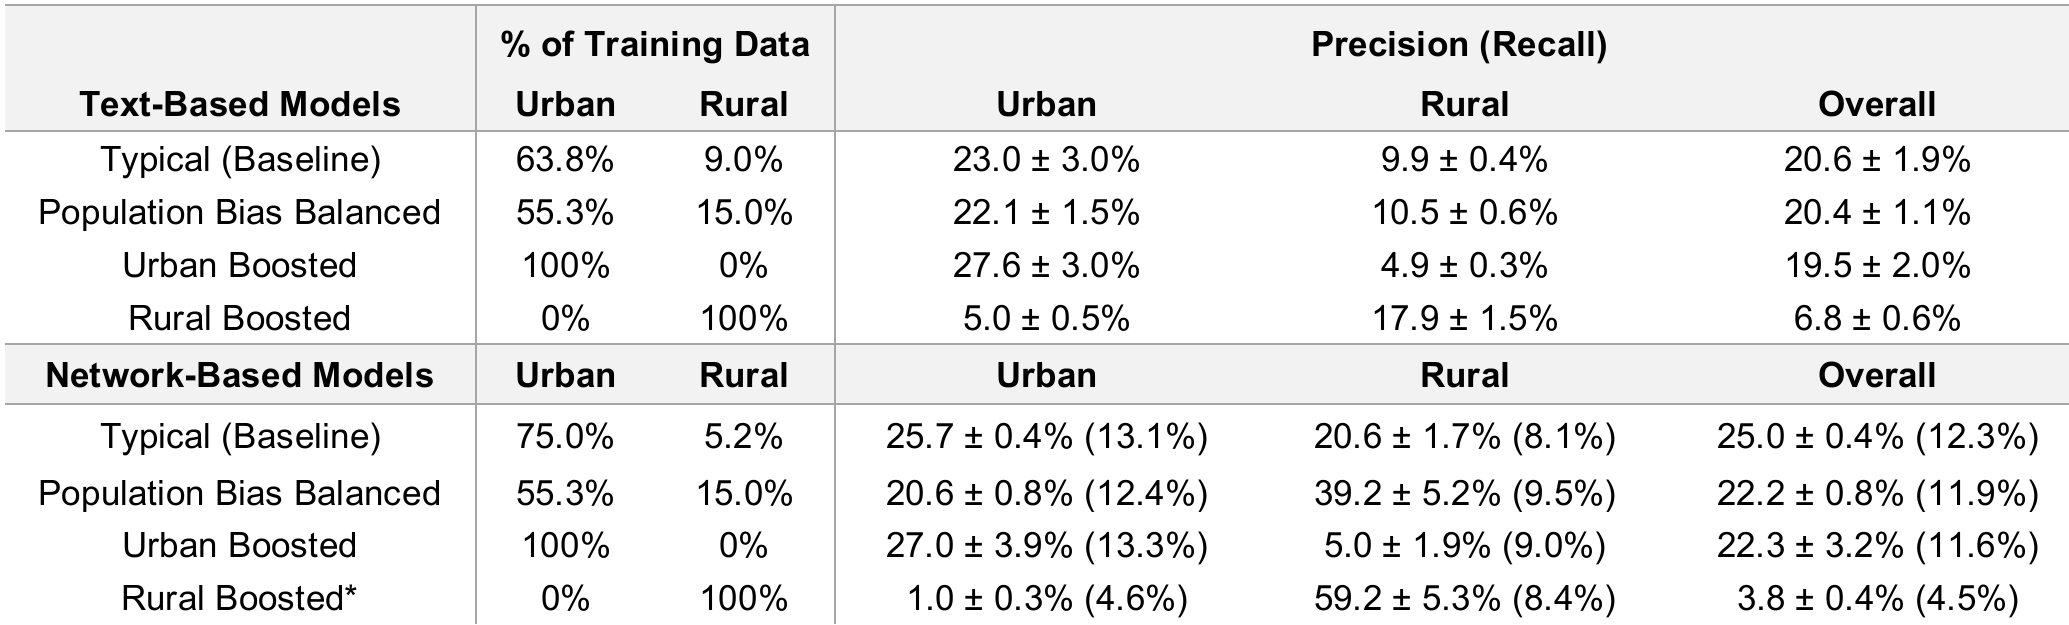
As shown in Table 1, "Overall" precision (the metric most engineers optimize for) actually drops when you try to make the model fairer for rural users. Because urban users are the majority of the dataset, "optimizing for the average" is effectively "optimizing for the urban," creating a perverse incentive to ignore minority (rural) populations.
Critical Analysis & Takeaways
This paper is a wakeup call for AI practitioners.
- The Myth of More Data: Simply "collecting more data" won't solve bias if the algorithm's internal logic (like spatial autocorrelation assumptions) is urban-centric.
- Audit Your Tools: If your product uses geolocated social data for public health or marketing, you are likely missing rural signals by a factor of 2x.
- The Paradox of Privacy: There is a silver lining. Rural users’ "geolocatability" is lower, granting them a form of "privacy by design" against automated surveillance—an unintentional but significant benefit.
Conclusion: To build truly global AI, we must move beyond global metrics. We need "Algorithmic Accountability" that peers into the architecture, ensuring our models don't just count heads, but understand the different contexts those heads reside in.