
Decoding the Complexity of Poverty: A Spatial Data Mining Approach to Policy
Poverty and Its Relation to Crime and the Environment: Applying Spatial Data Mining to Enhance Evidence-Based Policy
This paper presents a spatial data mining framework using Naive Bayes classifiers and binomial tests to analyze the complex relationships between multidimensional poverty, crime types, and ecosystem integrity in Mexico. By processing fine-grained spatio-temporal datasets, the authors identify specific socio-economic risk factors that drive social and environmental phenomena.
TL;DR
Researchers have leveraged spatial data mining to prove that the relationship between poverty, crime, and the environment is not a "one-size-fits-all" equation. Using Mexico as a case study, the research demonstrates that while poverty is a massive driver for domestic violence, it plays a secondary role in environmental degradation and property crime, providing a new roadmap for Evidence-Based Policy (EBP).
Problem & Motivation: Beyond Simple Correlations
Governments often treat poverty as a singular, monolithic cause for every social ill. However, the "Data Revolution" has shown us that social phenomena are non-linear and complex. Previous attempts to link poverty to crime often failed because they didn't account for where things happen (spatial context) or the type of poverty involved (e.g., lack of education vs. lack of infrastructure).
The authors' insight was to stop looking for global trends and start looking for local niches. They asked: Can we isolate the specific DNA of a crime or an environmental threat using spatial characteristics?
Methodology: The Math of Statistical Significance
The core of this work lies in two steps: identifying significant drivers and then predicting risk.
- Binomial Diagnostics (): The researchers used a binomial test to see if a feature (like "households with one bedroom") appeared more often in high-crime areas than would be expected by chance. A value of indicates a 95% confidence level.
- Naive Bayes Classifier: They then combined these significant features into a scoring function to map out high-risk zones.
 Figure 1: Conceptual framework linking Sustainable Development Goals (SDGs) to data mining.
The "Naive" part of the Bayes classifier assumes variables are independent—a simplification that, in spatial contexts, allows for rapid calculation and surprisingly high accuracy when dealing with massive census datasets.
Experimental Insights: Not All Crimes are Created Equal
1. The Anatomy of Domestic Violence (DV)
The results for DV were stark. The variables with the highest values (statistical significance) were:
- Low Education: Males with only primary school completion.
- Economic Stress: Lack of cars, telephones, and high occupant-per-room ratios.
- Demographics: High density of infants (0-2 years).
This paints a profile of "economically stressed households" living in crowded spaces.
2. Ecosystem Integrity vs. Infrastructure
Counter-intuitively, poverty was not the primary driver of environmental degradation. Instead, the strongest predictors were:
- Infrastructure: Minutes of access to major highways (high correlation with degradation).
- Urbanization: The number of schools per municipality.
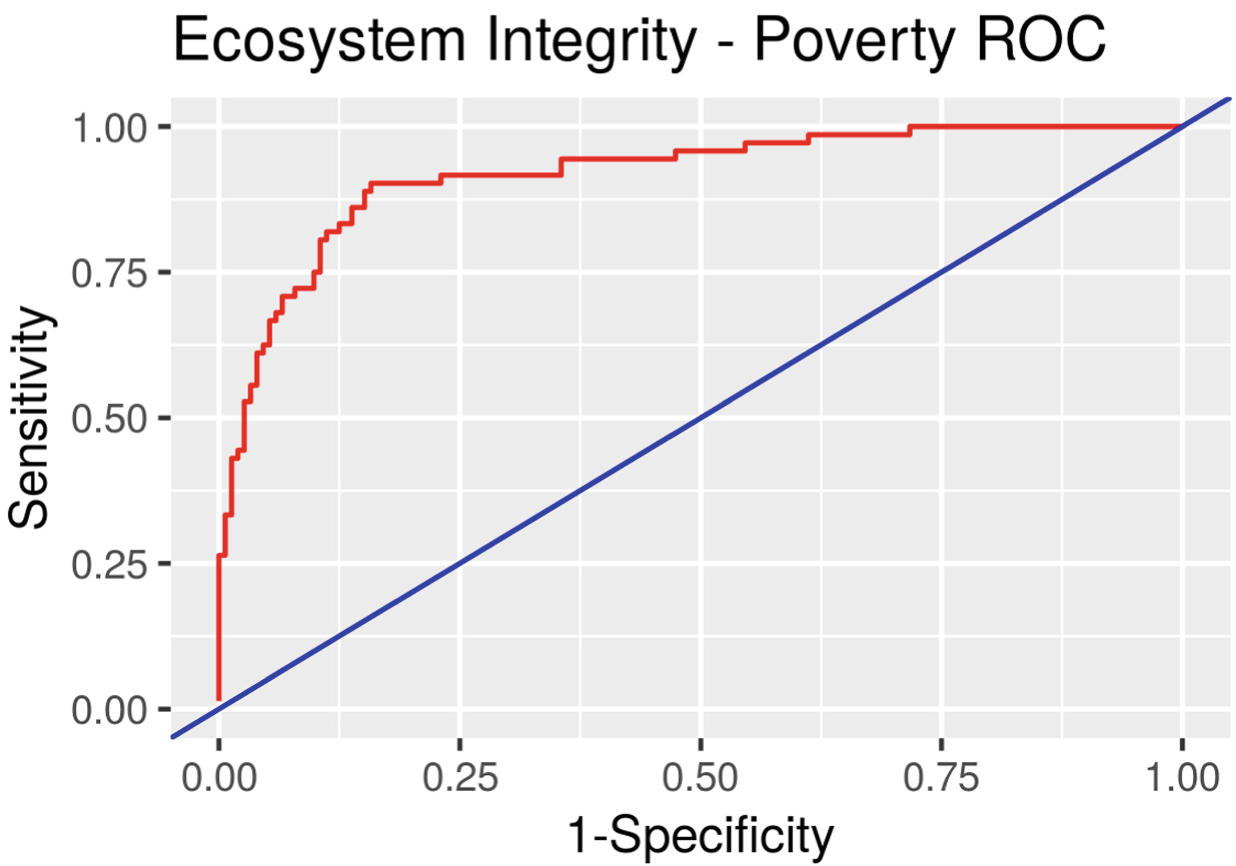 Figure 2: ROC Curve demonstrating the high predictive power of the Naive Bayes model for Ecosystem Integrity.
The ROC curve above shows that the model is highly effective at predicting ecosystem health based on these socio-economic and infrastructural proxies.
Detailed Results Map
The study produced "heat maps" that allow policymakers to see exactly where interventions are needed.
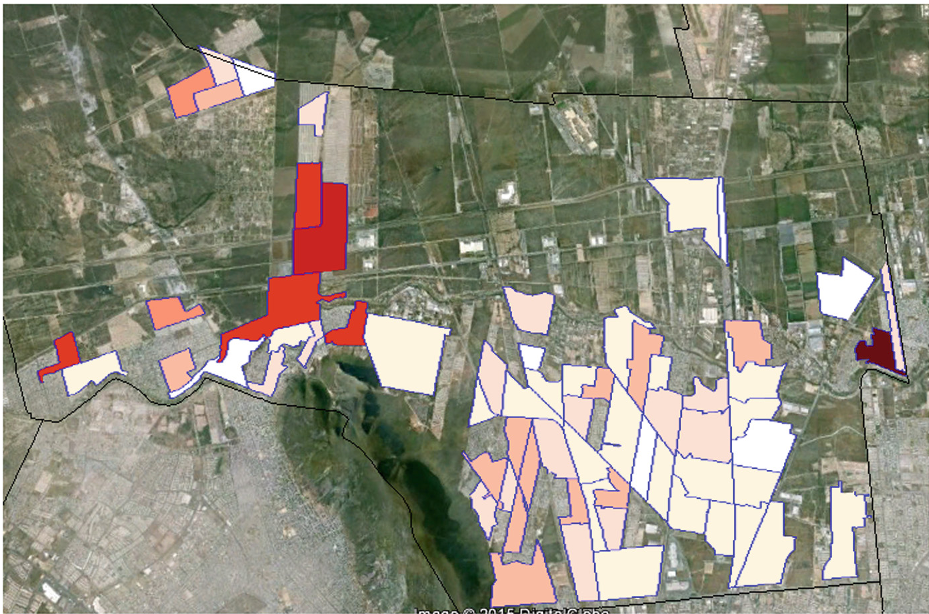 Figure 3: Heat map of Domestic Violence incidence in General Escobedo. Red zones indicate high-risk AGEBs identified by the model.
Critical Analysis & Conclusion
Takeaway
The study successfully moves the needle from "poverty causes crime" to "these specific dimensions of poverty cause this specific type of crime in this specific location." For example, property crime (Burglary/BR) requires wealth to be present (target-rich environments), while DV is fueled by the stress of lack.
局限性 (Limitations)
- Causality vs. Correlation: While the diagnostic finds strong correlations, it doesn't strictly prove causality.
- Data Granularity: The ecosystem integrity data (1 km²) is coarser than the crime data (AGEB), which might mask even finer-scale interactions between local communities and their environment.
Future Outlook
This approach paves the way for "Precision Policy." Instead of general social spending, a city could see that a specific neighborhood needs adult education (to reduce DV) while another needs better highway environmental offsets. The integration of Spatial Data Mining into daily governance is no longer a luxury; it is a necessity for achieving the UN Sustainable Development Goals.