
The Power of the Blue Tick: Decoding Ugandan Twitter Dynamics During COVID-19
The Power of the Blue Tick ( The Power of the Blue Tick ( ): Ugandans' experiences and engagement on Twitter at the onset of the COVID-19 pandemic
This study investigates the usage of Twitter in Uganda during the onset of the COVID-19 pandemic through a mixed-methods analysis of 28,587 tweets. It identifies five unique topic clusters—Coronavirus, First Case, Presidential Address, Lockdown, and Truck Drivers—and demonstrates that verified accounts ("Blue Tick") significantly command higher user engagement than unverified ones.
TL;DR
As the COVID-19 pandemic took hold in early 2020, how did the Ugandan public react to a flurry of presidential addresses and lockdown orders? This research by Kirabo et al. analyzes nearly 30,000 tweets to show that the "Blue Tick" (account verification) acts as a critical heuristic for trust, and that localized issues—specifically the movement of truck drivers—dominated the digital discourse just as much as the virus itself.
Background Positioning
In the world of Crisis Informatics, most SOTA research focuses on events like Hurricane Sandy or Western outbreaks. This paper is a significant contribution to the AfriCHI community, providing a rare and rigorous look at the African digital experience. It moves beyond mere "social listening" by using statistical modeling to prove how platform design (heuristics) affects the flow of vital information during a national emergency.
Problem & Motivation: The Credibility Gap
During a crisis, misinformation spreads as fast as a virus. The Ugandan government used "Presidential Addresses" as a primary tool, but how did these messages propagate online? The authors realized that while we know people use Twitter during disasters, we didn't know why certain accounts in the African context were more "retweetable" than others. Was it the content, or the badge of authority?
Methodology: The Core
The researchers used a robust mixed-methods pipeline:
- Data Hydration: Filtering millions of global tweets down to 28,587 Uganda-specific entries using keywords like
#m7addressandstaysafeug. - Louvain Clustering: A mathematical approach to find "communities" of words. This revealed that the conversation wasn't just about "health"—it was about the logistics of life.
- Mixed-Effects Regression: To account for users posting multiple times, they used a baseline model to see if verification status truly increased retweets.
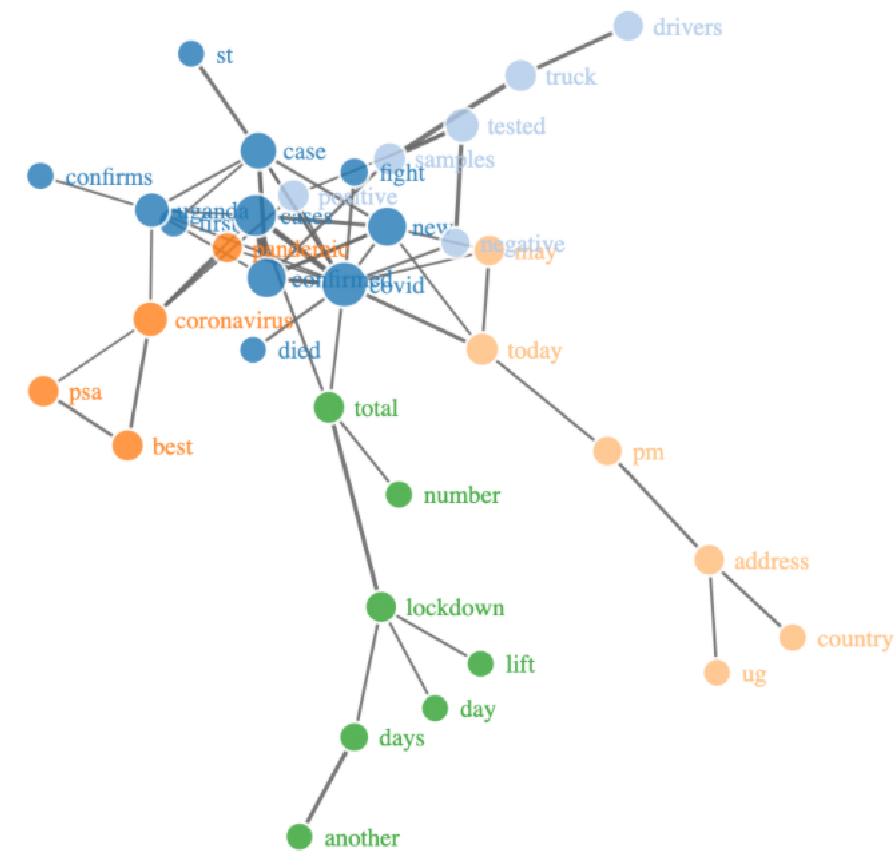 Figure: The network representation of the five identified clusters shows the distinct separation between global health concerns and local economic impacts.
Experiments & Results: The "Truck Driver" Insight
One of the most fascinating findings was the Truck Drivers Cluster. Because Uganda is landlocked, truck drivers were essential for trade but viewed as "Patient Zero" threats. The qualitative analysis found that citizens were effectively "pseudo-journalists," live-tweeting the President's words and debating the trade-offs between "Public Health vs. Trade."
On the quantitative side, the "Blue Tick" proved its worth. The study found a significant interaction (p = .0129) between verification and follower count.
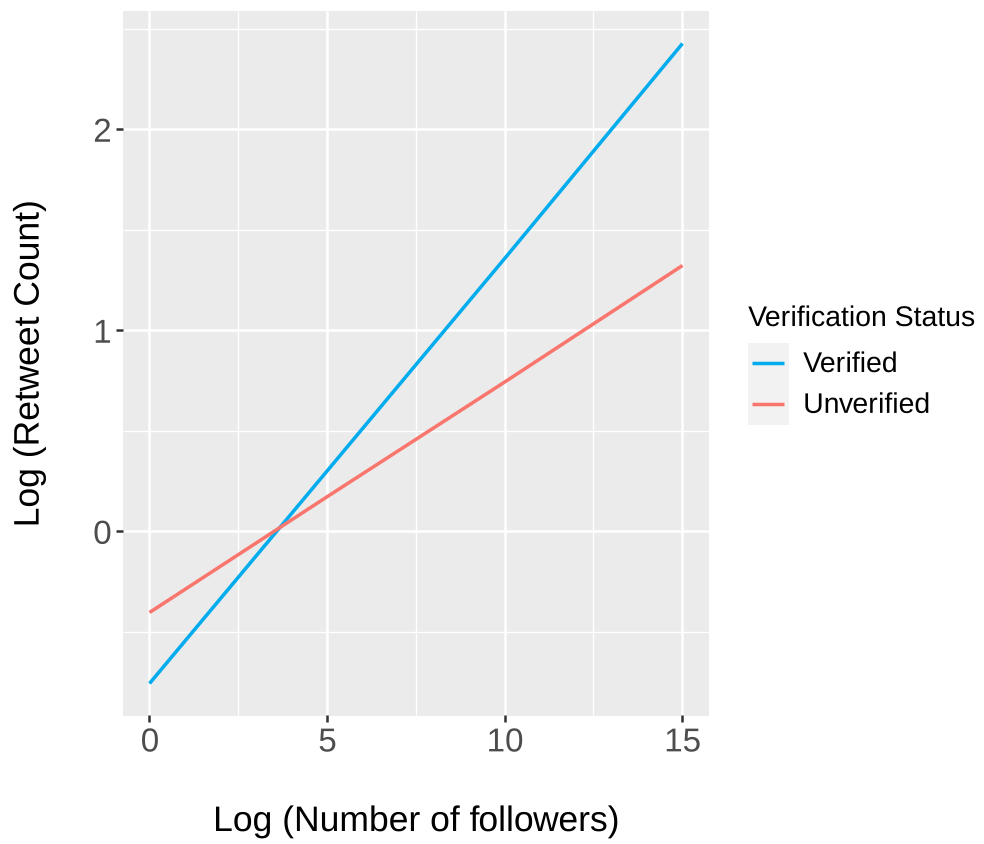 Figure: The interaction effect shows that while more followers generally lead to more engagement, the "verified" status provides a massive boost in reach compared to unverified accounts with the same follower count.
Critical Analysis & Conclusion
Takeaway
For public health officials, the study offers a clear mandate: Get Verified. The "Blue Tick" is more than a badge; it is a signal that cuts through the noise of a crisis. Furthermore, the reliance on humor (the "Lockdownians") shows that social media serves as a vital psychological support channel when physical traditions (like Easter village visits) are interrupted.
Limitations
The study is limited by its focus on English-only tweets. In a linguistically diverse country like Uganda, much of the discourse likely happened in Luganda or other local languages, which might have different sentiment profiles. Additionally, the data is pre-2022, meaning it doesn't reflect the recent changes in Twitter’s (now X) verification policy.
Future Outlook
This work lays the groundwork for "Human-Centered Computing" in Africa. Future research should look at cross-platform dynamics—how does a Presidential address move from a live TV broadcast to a Tweet, and then into a WhatsApp group? Understanding this "Information Genealogy" is the next frontier for pandemic preparedness.