
Power Grid as a Social Network: Modeling Frequency Oscillations via Epidemic Propagation
A framework of frequency oscillation in power grid: Epidemic propagation over social networks
This paper introduces a novel data-driven framework for analyzing power grid frequency oscillations by modeling them as epidemic propagation over social networks. Utilizing Bayesian Network Structure Learning on real US FNET measurements, the authors construct a logical network that mimics a "Small World" topology to describe the spread of frequency deviations using the Susceptible-Infectious-Susceptible (SIS) model.
TL;DR
What if a power grid "fever"—a frequency oscillation—spreads exactly like the flu through a group of friends? This paper demonstrates that frequency deviations in the US power grid propagate across a logical "Small World" network that can be accurately modeled using the Susceptible-Infectious-Susceptible (SIS) epidemic framework. By moving from physical circuit equations to phenomenological network dynamics, the authors achieved an oscillation prediction model with only ~1.4% error.
The Motivation: From Physics to Phenomena
Analyzing frequency stability is critical for preventing massive blackouts. Usually, engineers look at the grid as a collection of synchronized generators (physics-based modeling). However, physical connectivity data is often proprietary or incomplete.
The authors' key insight is that we don't need the physical wiring diagram to understand oscillation spread. Instead, we can look at the influence one location has on another—a Logical Network. If Location A's frequency drops and Location B follows shortly after, there is a logical "social" link between them, regardless of the miles of cable in between.
Step 1: Learning the Grid's "Social Circle"
The researchers used data from 89 Frequency Disturbance Recorders (FDRs) across the US. To build the logical network, they turned to Bayesian Network Structure Learning (BSL). They compared three different methods:
- Classical K-2 algorithm
- Iterative K-2
- L1 Regularization (BSL-3) — This proved superior because it effectively penalized unnecessary edges, resulting in a cleaner map that accurately mirrored the actual geographical interconnection units of North America.
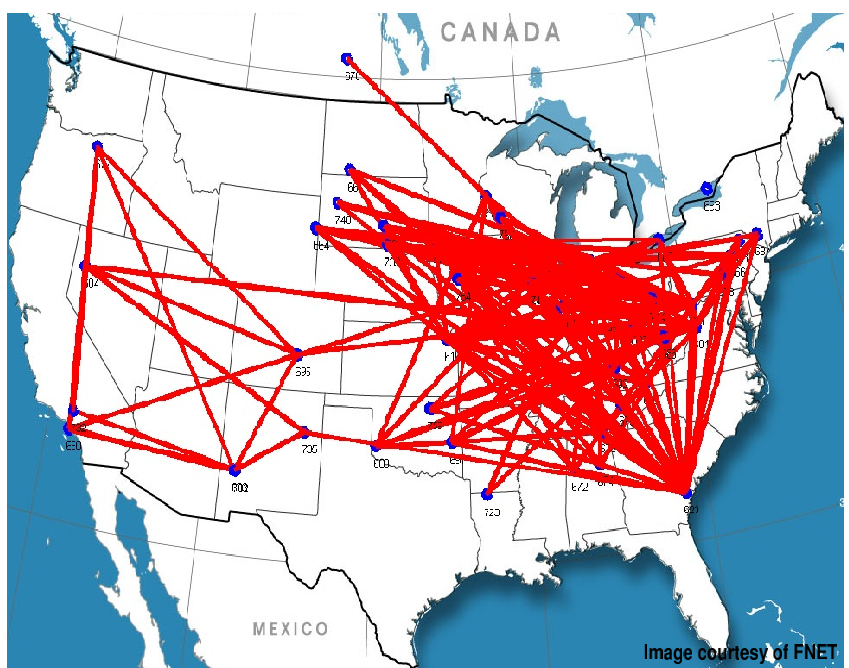 Fig. 5: The logical structure learned from L1 regulation (BSL-3). Notice how it groups nodes into recognizable clusters.
Step 2: The SIS Model of "Infection"
Once the network was established, the authors applied the SIS Model. In this context:
- Susceptible (S): The location's frequency is stable (near 60Hz).
- Infected (I): The location's frequency has deviated significantly (the "fever").
- Infection Rate (): How easily a deviation at one node spreads to its logical neighbors.
- Recovery Rate (): How quickly a node returns to the standard frequency.
The dynamics are governed by these differential equations:
Experimental Verification: Does it work?
The researchers tested their model against real frequency measurements during an oscillation event. They found two ways to calibrate the model:
- Direct Fitting: Optimizing and to match the curve.
- Topology-Based: Deriving parameters directly from the "Small World" properties (Poisson degree distribution) of the learned network.
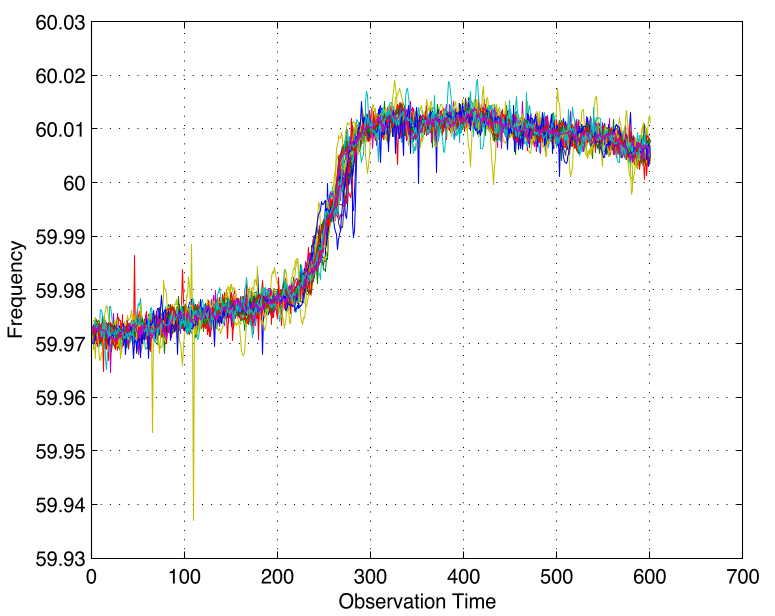 Fig. 8: The SIS model (red dashed line) shows a near-perfect overlap with the real grid data (blue line).
The Kolmogorov-Smirnov (K-S) test confirmed that the degree distribution of the grid's influence network follows a Poisson distribution, characteristic of Small World networks. This is a profound finding: it means the power grid has a "hub-and-spoke" logical efficiency that makes it both robust and susceptible to rapid "viral" propagation of errors.
Critical Analysis & Takeaways
This paper shifts the paradigm of grid stability from heavy electrical engineering to Data-Driven Network Science.
Strengths:
- Agnostic to Physics: Works even when you don't know the exact parameters of every generator.
- Phenomenological Accuracy: The SIS model captures the "tipping point" behavior of grid failures better than many linear models.
Limitations:
- Frequency Recovery: The current study observed events where nodes stayed "infected." Real-world oscillations often recover (requiring an SIR or SIRS model), which the authors plan to address in future work.
- Threshold Sensitivity: The "infection" status depends heavily on the chosen frequency threshold (), which may vary by grid region.
Future Outlook
By treating the grid as a social entity, we can borrow "immunization" strategies from epidemiology. Perhaps we can prevent blackouts not by bracing the whole grid, but by "vaccinating" high-degree logical hubs through localized energy storage or faster switching.