
Decoding Autism: Using Eye-Tracking and Machine Learning to Quantify Social Cognition
Predicting Core Characteristics of ASD Through Facial Emotion Recognition and Eye Tracking in Youth
This study presents a machine learning framework using a Random Forest regressor to predict Autism Spectrum Disorder (ASD) core characteristics based on eye-tracking data and task performance. By analyzing youth during a facial emotion recognition task (DARE), the method accurately estimates symptom severity as measured by the SRS-2 and RBS-R assessments.
TL;DR
Researchers have developed a machine learning model that "reads" an individual's eye movements during facial emotion recognition to predict the severity of Autism Spectrum Disorder (ASD) symptoms. By combining gaze patterns with reaction times, the team achieved significant accuracy in predicting scores on standard clinical assessments (SRS-2 and RBS-R), moving us closer to objective, biomarker-based diagnostics for neurodevelopmental disorders (NDDs).
The Problem: Subjectivity in a Heterogeneous Landscape
Autism Spectrum Disorder is notoriously heterogeneous. Diagnosis typically depends on behavioral observations and parent-report questionnaires like the Social Responsiveness Scale (SRS-2). While effective, these methods are inherently subjective.
Previous research has shown that individuals with ASD don't just "see" faces differently—they acquire information through atypical pathways. While an adult with ASD might correctly identify an emotion, their eyes may have focused on the background or the chin rather than the eyes and mouth. The challenge lies in converting these subtle, high-dimensional gaze patterns into a reliable score that reflects clinical reality.
Methodology: The DARE Task and Random Forest Regression
The authors employed the Dynamic Affect Recognition Evaluation (DARE) task. Participants view a face that "morphs" from a neutral expression into one of six emotions (e.g., happiness, fear).
Feature Extraction Pipeline
- Behavioral Metrics: Reaction Time (RT) and relative RT.
- Fixation Maps: The researchers divided the face region into a grid. They calculated the density of fixations in each bin to create a "heat map" of where the participant looked.
- Dimensionality Reduction: Using Principal Component Analysis (PCA), the combined 38-dimensional feature vector (36 for the map + 2 behavioral) was reduced to a 16-dimensional vector to prevent overfitting.
- The Regressor: A Random Forest model was trained using leave-one-out cross-validation to predict assessment scores.
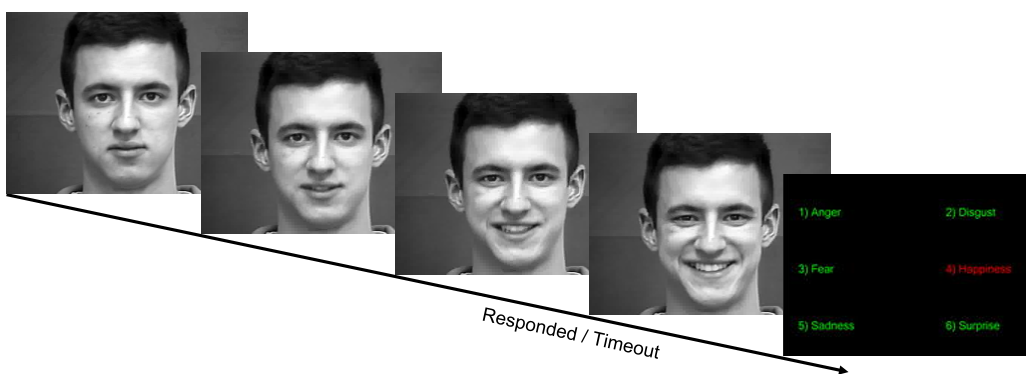 Fig 1: The DARE task transitioning from neutral to happiness.
Key Insights from Experimental Results
The study included a critical mix of participants: Typically Developing (TD), ASD, and those with ADHD or comorbid ASD+ADHD.
Predicting Social and Repetitive Behaviors
The model's ability to predict SRS-2 scores () was particularly impressive. As shown in the regression plots, the model consistently predicted higher scores for the ASD group and lower scores for TD controls, mirroring the clinical reality.
Interestingly, for the RBS-R (Repetitive Behavior Scale), the model's predicted scores actually provided better separation between ASD and TD groups than the raw observed scores, suggesting the machine learning approach might filter out some of the "noise" or bias found in subjective parental reporting.
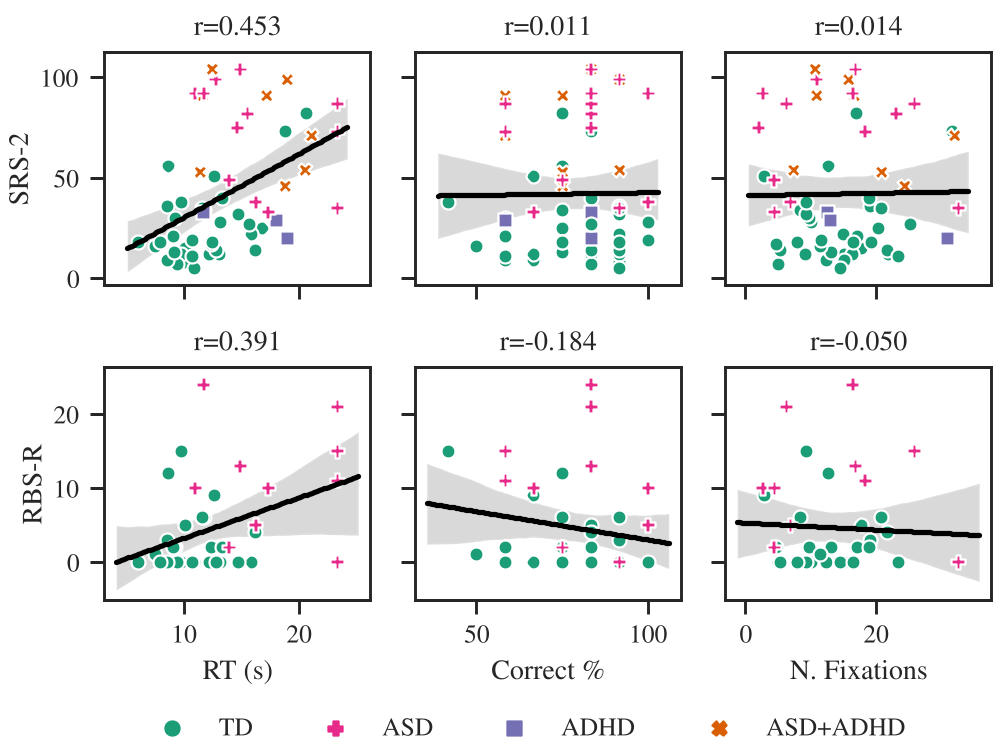 Fig 2: Prediction accuracy for SRS-2 total and subscale scores showing clear group separation.
Classification Power
The ROC Analysis (Area Under the Curve) confirmed that the eye-tracking task alone serves as a potent classifier for ASD, with performance comparable to specialized clinical assessments.
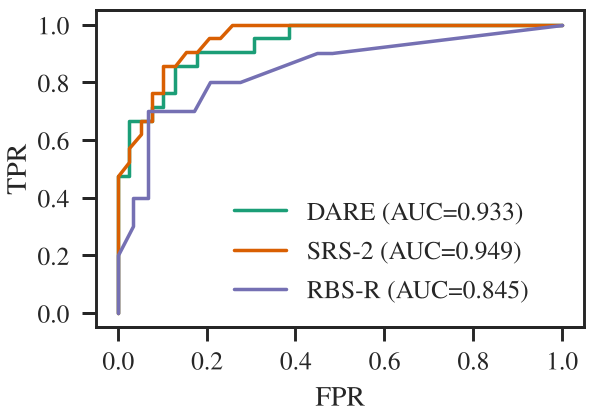 Fig 3: ROC curves demonstrating the diagnostic potential of the DARE eye-tracking task.
Critical Analysis & Future Outlook
While the results are promising, several considerations remain:
- Sample Size: With 60 participants, the model is a successful proof-of-concept. Scaling to larger, more diverse datasets is essential for clinical deployment.
- The Comorbidity Challenge: A significant strength of this study was the inclusion of ADHD. The model's ability to place ADHD participants in a "middle ground" of social deficit scores highlights the nuance required when dealing with overlapping NDDs.
- Next Steps: Moving from fixation maps to deep learning architectures (like CNNs or Temporal Transformers) could capture the sequence of gaze movements, likely uncovering even deeper "endophenotypes" of how the autistic brain navigates the social world.
Conclusion: This work bridges the gap between lab-based eye-tracking and clinical diagnosis, offering a path toward more objective, automated support for neurodevelopmental assessments.