
Decoding the Biological Clock: Predicting Brain Age via Complex Networks and Deep Learning
3217_Predicting brain age with complex networks From adolescence to adulthood.
This paper introduces a novel brain age prediction framework that transforms T1-weighted MRI scans into complex structural networks. By extracting simple nodal centrality measures (specifically strength) and feeding them into a compact deep neural network, the authors achieved SOTA performance on the heterogeneous ABIDE dataset, reaching a Mean Absolute Error (MAE) of 2.19 years.
TL;DR
Predicting the "Brain Gap"—the difference between chronological age and biological brain age—is a critical marker for neurodegenerative and psychiatric health. This research presents a groundbreaking approach that treats the brain as a complex network of interconnected patches. By combining graph theory with deep learning, the researchers achieved a Mean Absolute Error (MAE) of just 2.19 years, outperforming several complex state-of-the-art models while remaining computationally efficient and highly interpretable.
Context & Motivation: Why Brain Age?
Brain aging is not a uniform process. Factors like HIV, schizophrenia, and diabetes can accelerate aging, creating a gap between how old you are and how old your brain appears to be. While previous methods used raw high-dimensional data (CNNs) or complex feature extraction, they often felt like "black boxes" or required massive computational power. The authors of this study sought a middle ground: a model that is robust to "noisy" multi-site data (like the ABIDE dataset) but simple enough to provide anatomical insights.
Methodology: From Voxels to Networks
The "magic" of this paper lies in its transformation of 3D MRI scans into a mathematical graph.
1. Network Construction
The pipeline involves two main phases: Modeling and Learning.
- Nodes: The brain is divided into rectangular boxes called "patches."
- Edges: The similarity between patches is measured using Pearson’s correlation of gray-level intensities.
- Sparsity: Connections with a correlation below 0.3 are discarded to remove noise.
2. The Learning Architecture
Instead of feeding the entire correlation matrix into a model, the authors extracted Nodal Strength—a measure of how "important" or well-connected a specific brain region is. These features (1,184 values per subject) were fed into a compact Feedforward Deep Neural Network.
 Figure 1: Overview of the methodology, showing the transition from MRI patches to a tabular representation of centrality measures for Deep Learning.
Experiments & Results: Robustness Across Sites
One of the biggest challenges in neuroimaging is "Site Heterogeneity"—data coming from different scanners and protocols. The authors tested their model on the ABIDE I dataset, which is notoriously "messy."
Key Metrics:
- Accuracy: MAE of 2.19 years ().
- Generalization: On a completely independent test set (Beijing Normal University data), the MAE remained stable at 2.52 years.
- Developmental Specialization: In the 7–20 age range, the error dropped to an impressive 1.53 years.
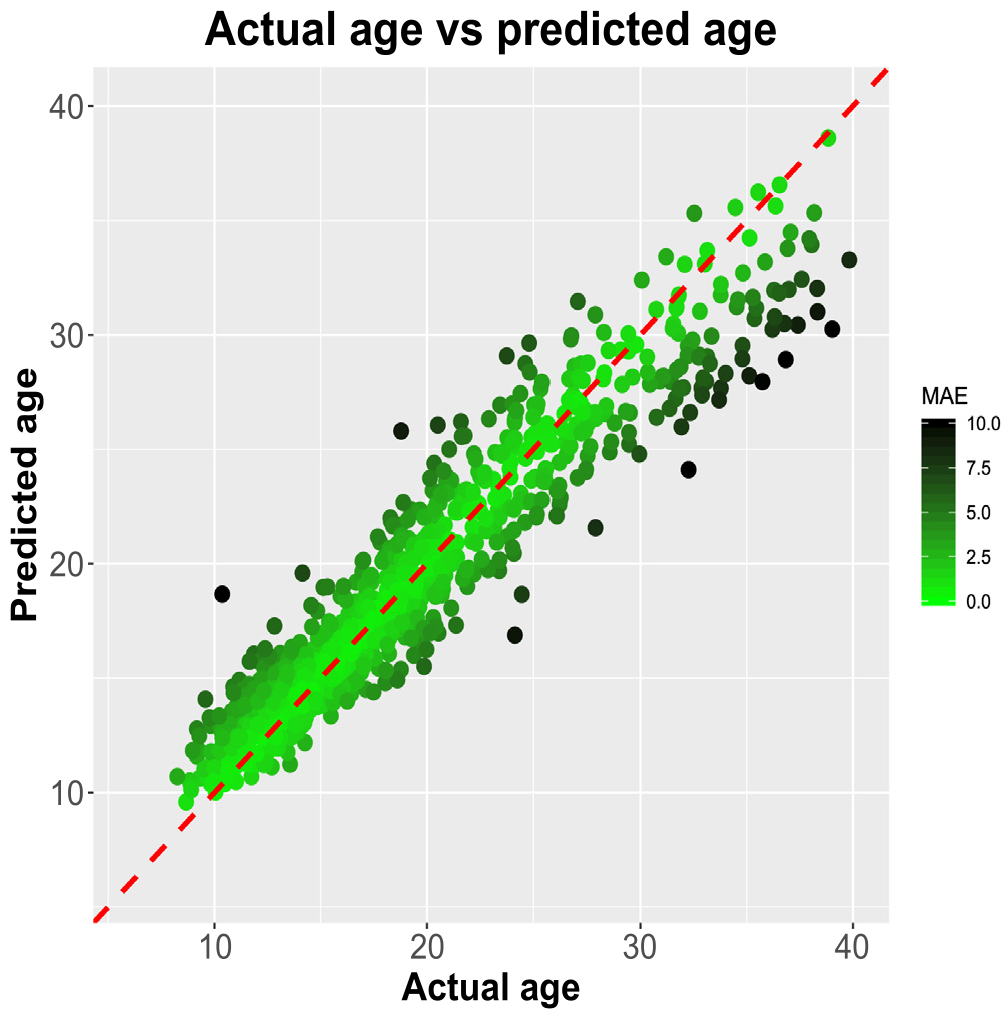 Figure 2: Predicted age vs. Actual age. The tight clustering around the diagonal line demonstrates the high precision of the Deep Learning regressor.
Ablation: Why Deep Learning?
The study compared the Deep Neural Network against various regressors (Random Forest, Lasso, SVM). While all performed relatively well, the DNN consistently showed significantly lower errors, suggesting that the relationship between brain connectivity and age is non-linear.
Clinical Insight: What Parts of the Brain Matter?
Unlike "black box" CNNs, this network model allows us to look back at which nodes were most influential. Using the Gedeon Method, the researchers identified that the Thalamus, Putamen, and White Matter in the frontal and limbic lobes were the most strategic predictors of age.
The Thalamus, in particular, is a vital hub for cognitive functions like memory and attention—areas known to decline or mature significantly during the transition from adolescence to adulthood.
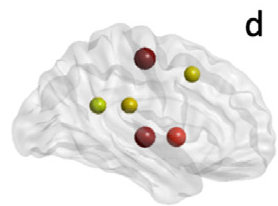 Figure 3: Glass brain visualization identifying the most important anatomical patches for age prediction. Color and size indicate the level of contribution to the model's accuracy.
Critical Insight & Conclusion
This work proves that structural connectivity is not just a theoretical concept but a practical biomarker. By reducing an entire MRI scan to a set of centrality measures, we lose the computational "bloat" while retaining the essential "signal" of aging.
Limitations: The model is somewhat sensitive to highly skewed age distributions and site-specific noise. Future work involving Data Harmonization techniques could potentially drive the error rate even lower, perhaps even below the 1-year mark.
Final Takeaway: If you want to build a robust medical AI, look at the connections (), not just the pixels ().