
Predicting Content Virality: A Temporal Shift in Social Cascade Analysis
Predicting Content Virality in Social Cascade
This paper introduces a novel algorithm to predict content virality by estimating the time required for a social cascade to reach a specific target size. Utilizing the concept of the Basic Reproduction Number (), the method provides a practical and computationally efficient way to forecast viral growth across social platforms like Digg.com.
TL;DR
Predicting virality has long been the "Holy Grail" of digital marketing. This paper shifts the focus from how many people will see content to how fast it will reach a specific viral milestone. By adapting the Basic Reproduction Number () from epidemiology, the HKUST researchers propose a self-correcting iterative algorithm that predicts the time-to-peak with high accuracy using minimal early-stage data.
Background: Popularity vs. Virality
In the context of social networks, popularity is a destination (total votes/shares), while virality is a process (the speed and breadth of spread). Most previous SOTA models tried to guess the final number of votes—a task fraught with uncertainty due to the "long-tail" nature of content. The authors argue that for real-world applications like viral marketing or cloud resource allocation, knowing when a target will be hit is far more valuable.
The Core Intuition: The Epidemiology of Information
The researchers treat a "share" or "vote" as an infection. In a social cascade:
- If : The content is viral; each infected user recruits more than one new user, leading to exponential growth.
- If : The cascade fizzles out.
The challenge is that isn't constant. A celebrity sharing a post creates a massive spike compared to an average user. To solve this, the authors don't just calculate a static ; they use an Iterative Approach.
Methodology & Mathematical Insight
The algorithm periodically scrapes data to calculate the current growth rate. It uses a geometric series summation to project forward:
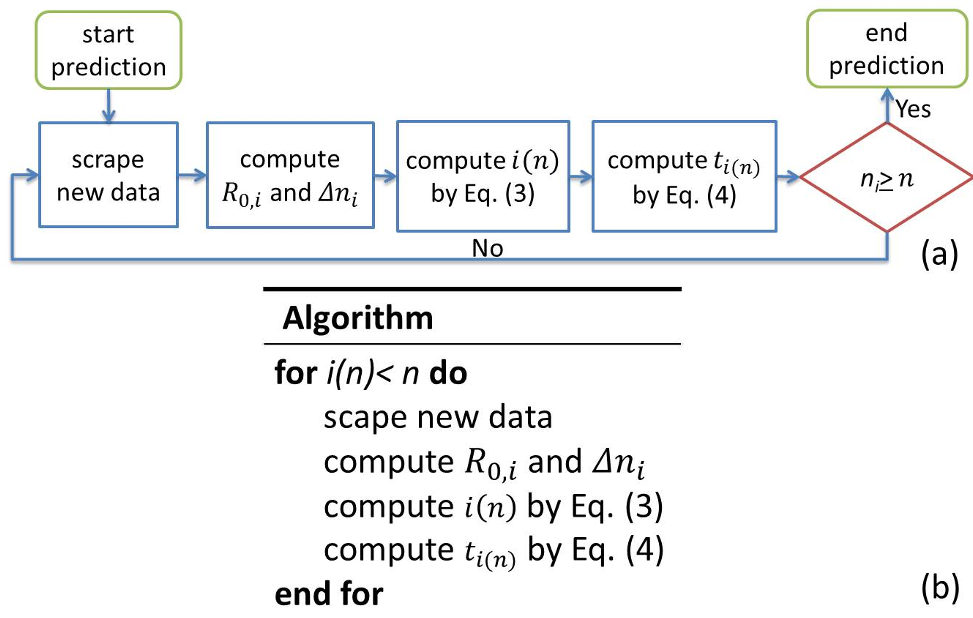
The predicted number of iterations to reach target is derived as: This formula captures the "acceleration" or "deceleration" of the cascade in real-time.
Experimental Evidence
The model was stress-tested against three distinct environments:
- Digg.com (Real Data): Tracking stories from 2006 and 2009.
- Forest Fire Model: A synthetic graph that mimics "densification" and "shrinking diameters" of real social networks.
- Kronecker Graphs: A robust mathematical model for generating realistic social topologies.
Performance Highlights
The results show a clear trend: as the cascade progresses, the "percentage error" () drops dramatically.
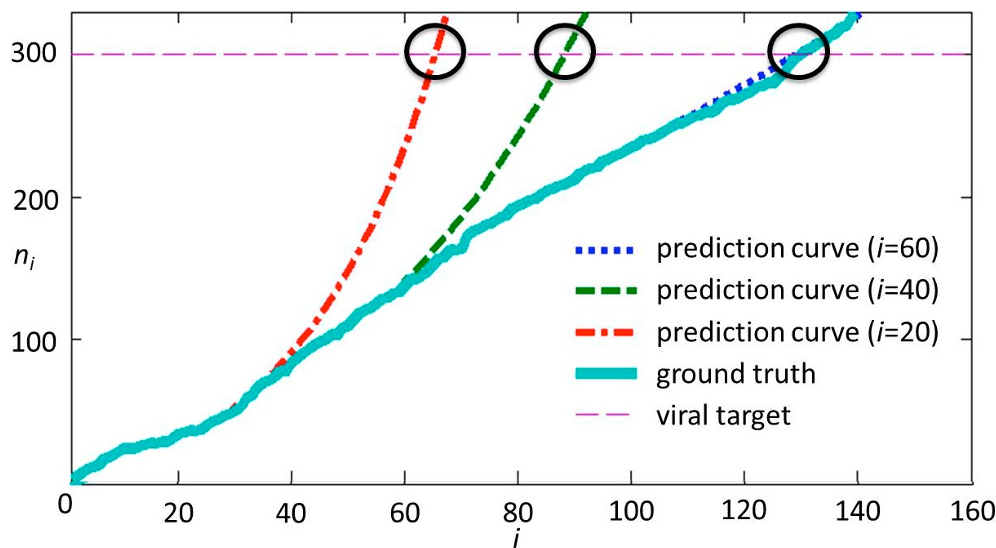
As seen in Fig. 6/7, during the "explosive phase" (where the curve steepens), the algorithm's self-correction kicks in. By the time 20% of the cascade data is available, the prediction error for the remaining duration falls below 20%.
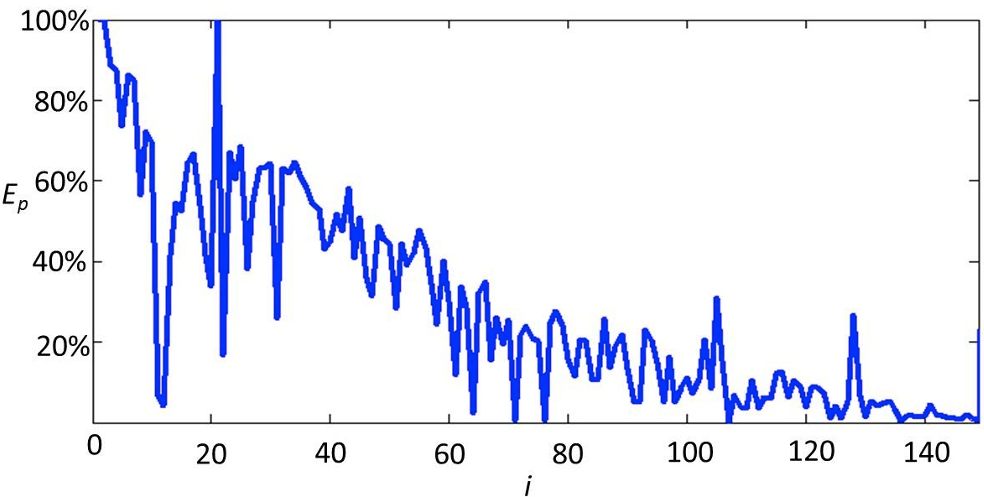 In Fig 8, we observe that the more iterations we perform, the closer the prediction aligns with the ground truth.
Critical Analysis & Takeaways
Why it works
Unlike feature-based models that need to analyze the text of a tweet or the bio of a user, this model is content-agnostic. It looks purely at the behavioral physics of the network. This makes it computationally light and highly scalable.
Limitations
- Sampling Frequency: The duration of the "iteration unit" is critical. If you sample too slowly, you miss the window of opportunity; if you sample too fast, the noise in might cause erratic predictions.
- Saturation: The current model assumes a simplified geometric growth which might ignore the "saturation point" where the content has reached everyone interested in it (the exhausted pool of susceptible nodes).
Conclusion
This HKUST study provides a robust framework for transitioning from "What will be popular?" to "How fast will it spread?". For platform engineers and marketers, the -based iterative approach offers a computationally cheap yet mathematically sound method to stay ahead of the viral curve.