
From Tweets to Trails: Quantifying Routine Activities for Precise Crime Prediction
Predicting crime with routine activity patterns inferred from social media
This paper introduces a novel crime prediction framework that reconstructs the daily routine activities of individuals by fusing Twitter metadata with Foursquare venue data. By integrating these micro-level movement patterns into a logistic regression model alongside historical crime densities (KDE), the authors achieve State-of-the-Art (SOTA) predictive performance across 15 out of 20 tested crime types in Chicago.
TL;DR
Researchers at the University of Virginia have developed a method to predict crime by "reading" the daily rhythms of a city. By mapping millions of tweets to logical places (like bars or offices) via Foursquare, they reconstructed the movement patterns of Chicago citizens. This micro-level behavioral data, when fed into a statistical model, outperformed traditional hotspots mapping in 15 out of 20 crime types, proving that where we go and when defines the city's risk landscape.
Background: Beyond the Static "Hotspot"
For decades, police departments have relied on Kernel Density Estimation (KDE)—essentially heatmaps of where crimes happened in the past—to guess where they will happen next. However, crime isn't static. Routine Activity Theory suggests that crime requires three elements to converge: a motivated offender, a suitable target, and the absence of a capable guardian. These three elements are constantly in motion as people go about their daily routines. The missing link in predictive policing has been a way to measure these "micro-level" routines at scale.
Methodology: Reconstructing the Human Routine
The authors hypothesized that social media posts provide a digital breadcrumb trail of these routines. Their pipeline consists of three innovative steps:
- Logical Place Mapping: Instead of just using raw GPS coordinates, tweets are matched to the nearest Foursquare venue (within 5 meters). This transforms a coordinate like
(41.87, -87.62)into a meaningful activity like "Travel & Transport" or "Nightlife Spot." - Daily Route Segmentation: Using an algorithm to detect "sleeping times" (periods of inactivity), the system splits a user's tweet history into distinct daily routes.
- The "Bag-of-Venues" Model: Similar to natural language processing, each route is treated as a "document" and each venue category as a "word." They use TF-IDF (Term Frequency-Inverse Document Frequency) to weight the importance of venue types. For instance, if a specific area sees a surge in "Nightlife" activity relative to its usual state, the model adjusts the risk score for crimes like robbery or assault.
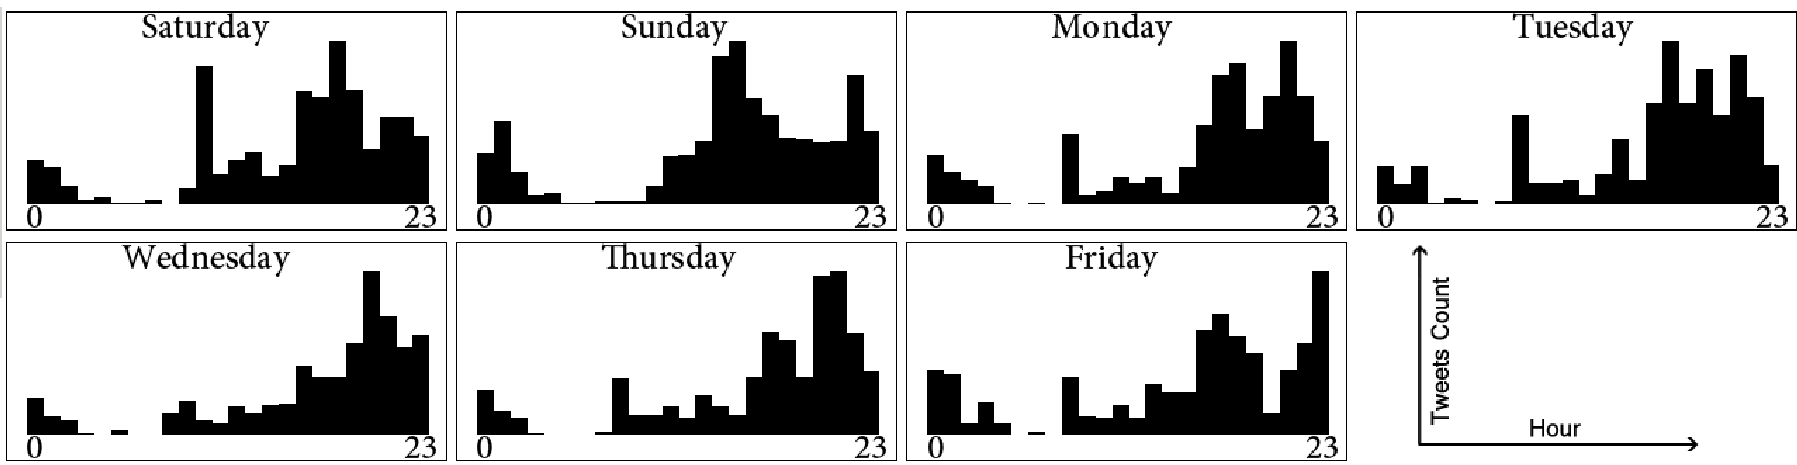 Figure 1: The process of segmenting user activity based on temporal patterns to define daily routes.
Experiments and Results
The model was tested using 9.2 million tweets and actual crime records from Chicago. The researchers compared their "Venue-Enhanced" model (KDE+T+R) against a baseline of historical density and time (KDE+T).
- Performance Leap: The addition of routine features (+R) improved the AUC across nearly all categories.
- Specific Insights: Narcotics crimes saw a massive +0.18 peak gain. Interestingly, the model found that "College & University" venues were negatively correlated with narcotics arrests, while "Shop & Service" venues were strong positive indicators.
- Operational Relevance: For "Public Peace Violations" and "Weapons Violations," the model achieved significant accuracy gains while only requiring patrols to cover 25% of the city area, making it highly practical for resource-strapped police departments.
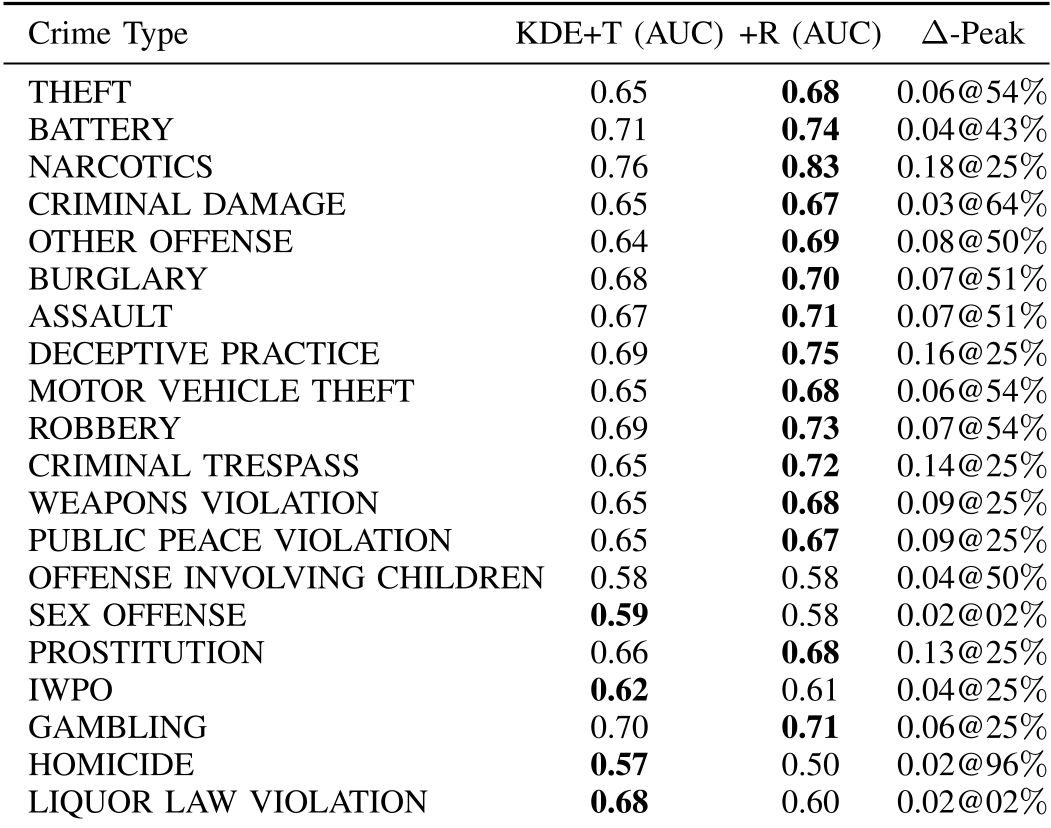 Table 1: Comparative Results showing the AUC improvement across various crime types.
Critical Insight: Why This Works
The brilliance of this work lies in its transition from text-based analysis to activity-based analysis. Previous social media crime models often looked for keywords like "gun" or "fight." This model ignores the text almost entirely, focusing instead on the context of the location. It understands the "pulse" of the neighborhood. If people are moving from "Work" to "Nightlife" in a specific pattern, the model catches the shift in the "Routine Activity" balance before a crime even occurs.
Limitations & Future Work
The model currently uses a "Bag-of-Venues" approach, which ignores the order of visits (e.g., going to a bar then a dark park vs. the other way around). Future iterations could benefit from sequence modeling (like RNNs or Transformers) to capture the trajectory of human movement. Additionally, the categorization of venues is still relatively broad; distinguishing between a "pawn shop" and a "luxury mall" within the "Shop & Service" category might yield even higher precision.
Conclusion
This study demonstrates that our digital footprint on Twitter and Foursquare is more than just social chatter; it is a mirrors of the physical routines that shape the safety of our cities. By quantifying the ebb and flow of human movement, we move closer to a proactive, rather than reactive, model of urban security.