
Predicting Vehicle Sales: The Synergy of Social Sentiment and Stock Markets
Predicting Vehicle Sales by Sentiment Analysis of Twitter Data and Stock Market Values
This paper introduces a hybrid forecasting framework that combines Twitter sentiment analysis, stock market indices (DJIA and S&P 500), and historical data to predict monthly vehicle sales in the USA. Using Least Squares Support Vector Regression (LSSVR) and deseasonalization techniques, the model achieves superior accuracy over traditional time series methods.
TL;DR
Predicting high-ticket purchases like vehicles requires more than just looking at the past. This paper demonstrates that Twitter sentiment and stock market values (DJIA/S&P 500) are powerful predictors of consumer behavior. By applying Least Squares Support Vector Regression (LSSVR) to deseasonalized hybrid data, the researchers achieved a remarkably low MAPE of 3.96%, significantly outperforming traditional statistical models like SARIMA.
Background & Motivation: Why Historical Data Isn't Enough
In the automotive industry, sales are influenced by a complex web of consumer confidence, economic health, and brand perception. Traditional methods like ARIMA or Exponential Smoothing are "backward-looking"—they assume the future is a function of the past.
The authors argue that two major signals are missing from these models:
- Electronic Word of Mouth (eWOM): Twitter captures real-time intent and satisfaction.
- The Wealth Effect: As stock market values rise, consumers feel wealthier and are more likely to commit to "high-involvement" goods like cars.
Methodology: The Hybrid LSSVR Framework
The researchers built a robust pipeline that processes nearly six million tweets (using keywords like "buy car") and financial indices.
1. Data Preprocessing & Sentiment Analysis
Text data is notoriously noisy. The authors used SentiStrength to assign polarity scores (from -5 to +5) to tweets. This transforms raw text into a quantitative "Sentiment Score" time series.
2. The Deseasonalizing Procedure
Vehicle sales are notoriously seasonal (e.g., spikes at year-end). To prevent the model from getting confused by these peaks, the authors "deseasonalized" not just the sales data, but also the Twitter sentiment and stock data.
3. LSSVR: Complexity Made Efficient
While standard Support Vector Regression (SVR) is powerful, its computational cost is high. Least Squares SVR (LSSVR) transforms the optimization problem into a set of linear equations, making it faster while maintaining the ability to capture non-linear relationships via the Radial Basis Function (RBF) kernel.
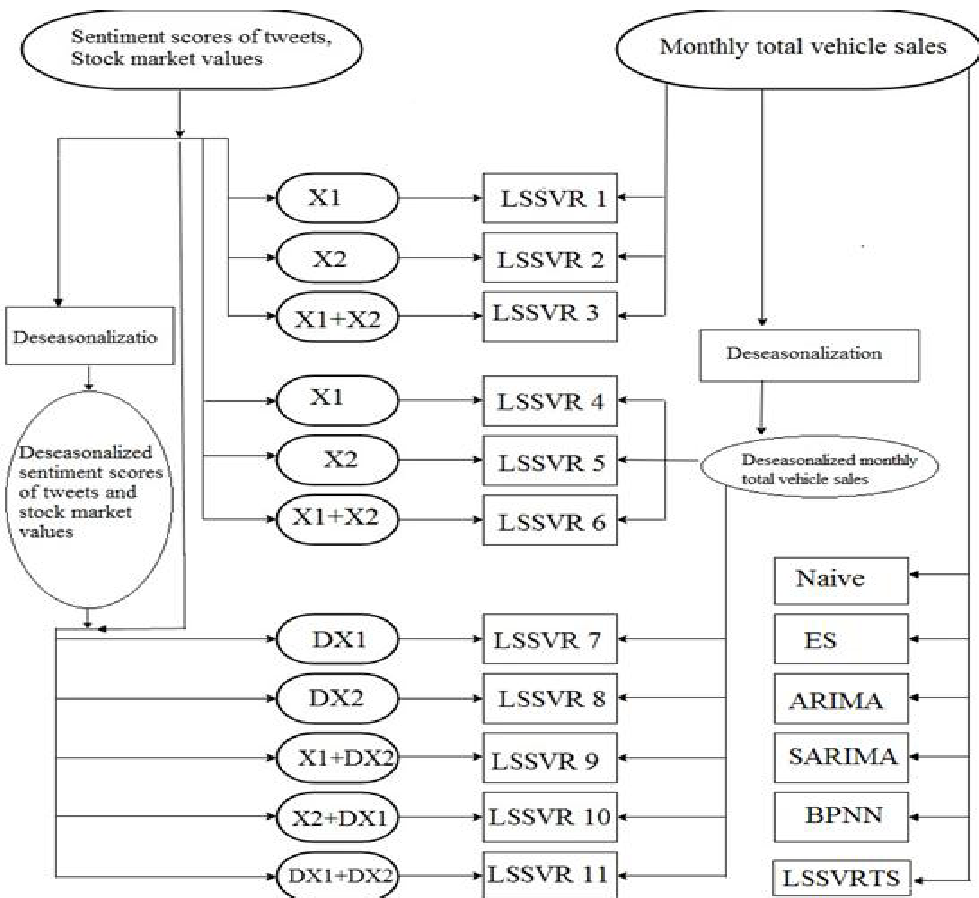 Figure 1: The proposed hybrid framework combining social media, stock data, and deseasonalization.
Experimental Results: Breaking the 4% MAPE Barrier
The study compared 11 different LSSVR configurations (using various data combinations) against 6 baseline time-series models.
- SARIMA (The baseline champion): 7.07% MAPE
- LSSVR with standard data: 6.63% MAPE
- LSSVR with Deseasonalized Hybrid Data (The Winner): 3.96% MAPE
The results prove that hybridization matters. Using sentiment data alone (LSSVR4: 4.91% MAPE) or stock data alone (LSSVR8: 5.27% MAPE) is good, but combining them after removing seasonal noise provides a significant accuracy boost.
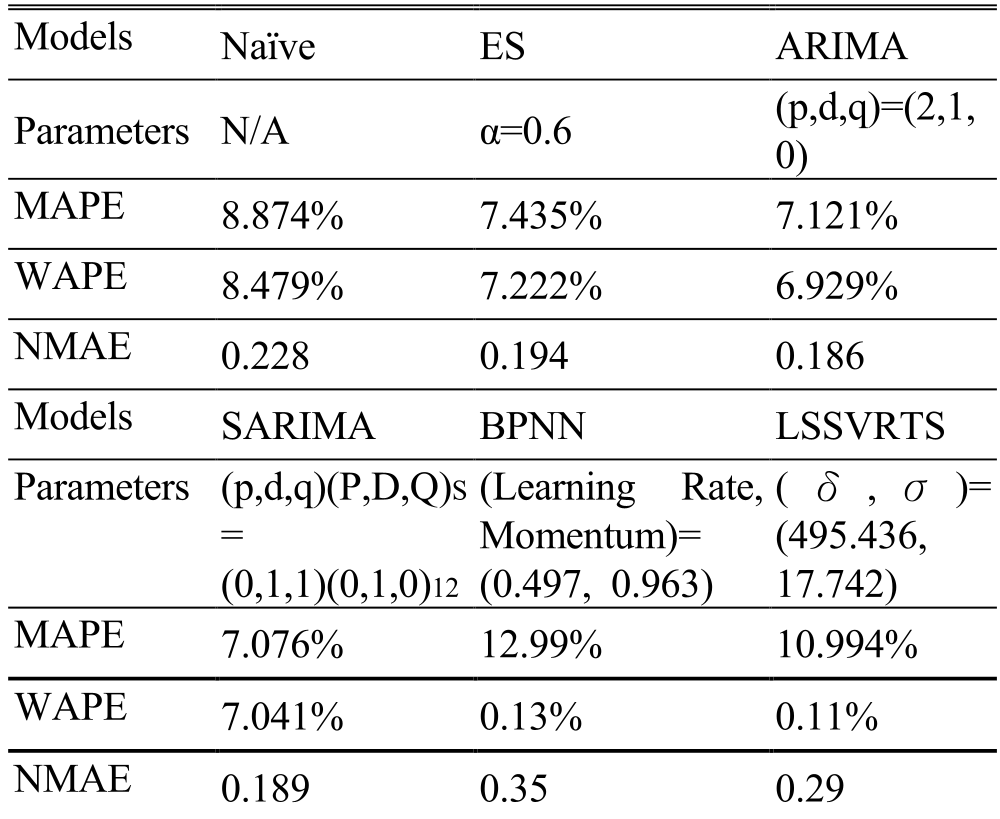 Table 1: Quantitative comparison showing SARIMA vs. Machine Learning approaches.
Critical Insight: Beyond the "Nowcast"
The real value of this research lies in its validation of sentiment as a leading indicator. While stock markets reflect the current macro economy, Twitter sentiment often captures the shifting intent of the youth and middle-class demographics before the actual purchase happens.
Limitations & Future Directions
- Keyword Sensitivity: Selection of keywords ("buy car") remains a manual process. Future work could use unsupervised clustering to find better features.
- Geographical Granularity: The study uses national-level data. Integrating geolocation data from tweets could allow for regional sales forecasting, which is critical for supply chain logistics.
Conclusion
By moving beyond internal sales logs and looking at the "digital heartbeat" of the consumer (Twitter) and the "financial barometer" of the nation (Stock Market), the automotive industry can predict demand with unprecedented precision. The combination of LSSVR and seasonal adjustment represents a state-of-the-art approach for economists and data scientists alike.