
Predicting Viral Peaks: How Facebook Data Can Optimize YouTube Content Delivery
Predicting YouTube content popularity via Facebook data: A network spread model for optimizing multimedia delivery
The paper introduces the Fast Threshold Spread Model (FTSM), a deterministic diffusion algorithm designed to predict YouTube video popularity by mining Facebook social network data. By leveraging user influence metrics and social connectivity, the model achieves a high correlation (ρ = 0.83) with global YouTube hit counts, enabling optimized multimedia cache management.
TL;DR
Researchers have developed the Fast Threshold Spread Model (FTSM), a tool that looks at how a video is shared on Facebook to predict its future popularity on YouTube. By analyzing a small "representative" social network, the model can predict viral outbreaks before they happen, allowing server providers to cache videos in advance and reduce streaming lag.
The "Flash Crowd" Problem in Multimedia Delivery
When a video goes viral, it experiences an explosion in demand that can overwhelm traditional network resources. Even a 5-second startup delay can lead to a 10% viewership abandonment rate. Currently, YouTube and other platforms use caching—storing copies of videos closer to users—to handle high traffic. However, these decisions are usually reactive (based on how often a video was already watched) rather than proactive.
The challenge lies in the sheer scale of social data. Predicting virality using the classic Independent Cascade Model (ICM) is too mathematically heavy for real-time decisions, especially when dealing with billions of nodes.
Methodology: FTSM and Social Influence
The core innovation of this paper is the Fast Threshold Spread Model (FTSM). Instead of complex probabilities for every single interaction, FTSM uses a deterministic approach based on a user's Social Influence Weight ().
1. Defining Social Influence
The researchers calculated influence by looking at:
- Activity Rate: Average posts per week.
- Engagement: Average likes, shares, and comments received.
2. The Spread Mechanism
If a video is shared by a "seed node" (an early viewer), the model checks their neighbors. If the neighbor's social influence meets a specific Threshold, they are marked as "active" (meaning they are likely to spread the content further).
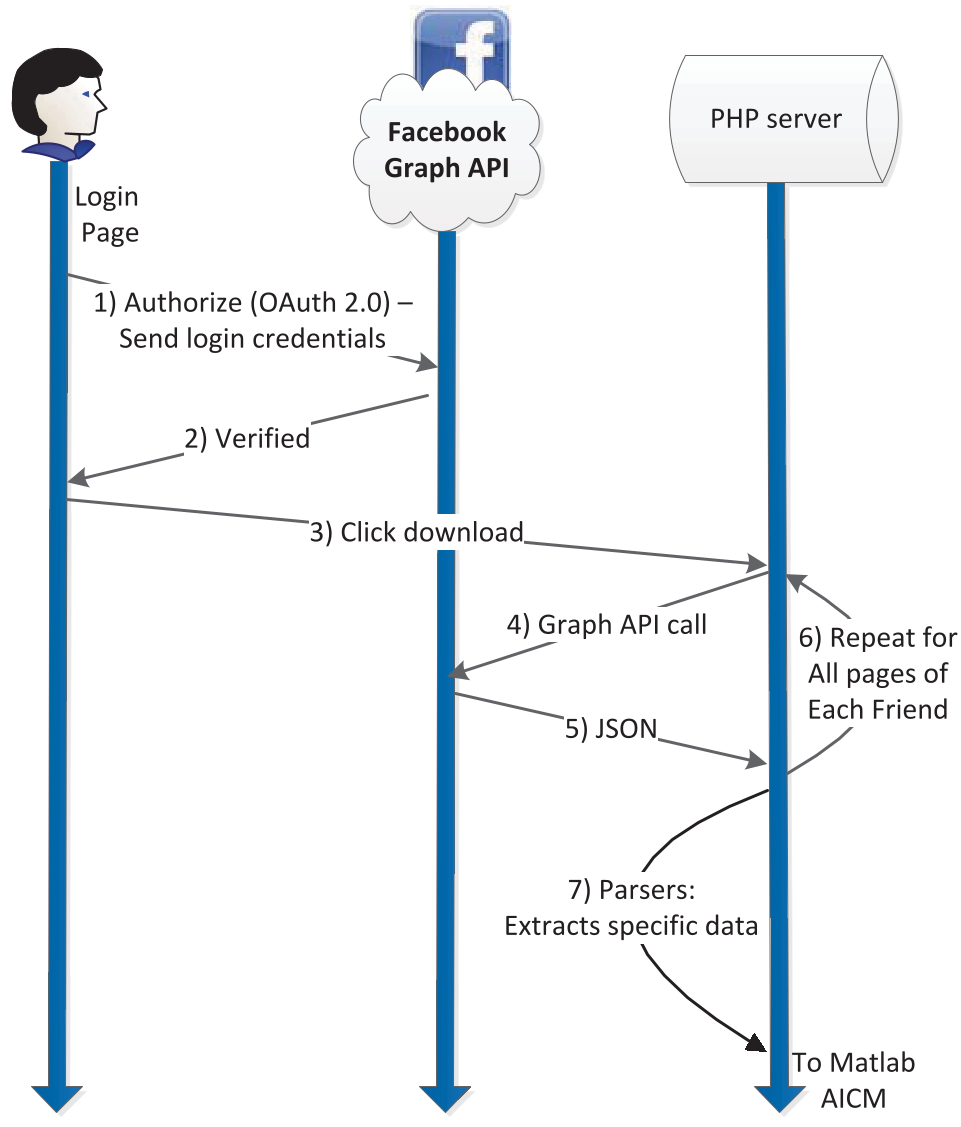 Fig 1: The infection process showing how content moves from seed nodes to their immediate social circle.
Data Mining: Bridging Facebook and YouTube
One of the paper's hurdles was that YouTube doesn't show who is friends with whom. The authors solved this by:
- Scraping Facebook: Building a social graph of 2,344 nodes.
- Extracting YouTube Statistics: Using a custom parser to reverse-engineer data from the Google Chart API to get "ground truth" hit counts.
The authors confirmed a Power Law distribution in their Facebook dataset, proving that while it was small, it behaved like a real-world large-scale social network.
Experimental Results
The FTSM was tested against the top 10 viral videos of the time. The results were striking:
- Leading Indicators: In most cases, the FTSM simulation "infected" the network earlier than the actual YouTube hit count rose. This provides the "window of opportunity" needed for pre-caching.
- High Accuracy: The model achieved a 0.83 Spearman correlation between predicted spread and actual global hit counts.
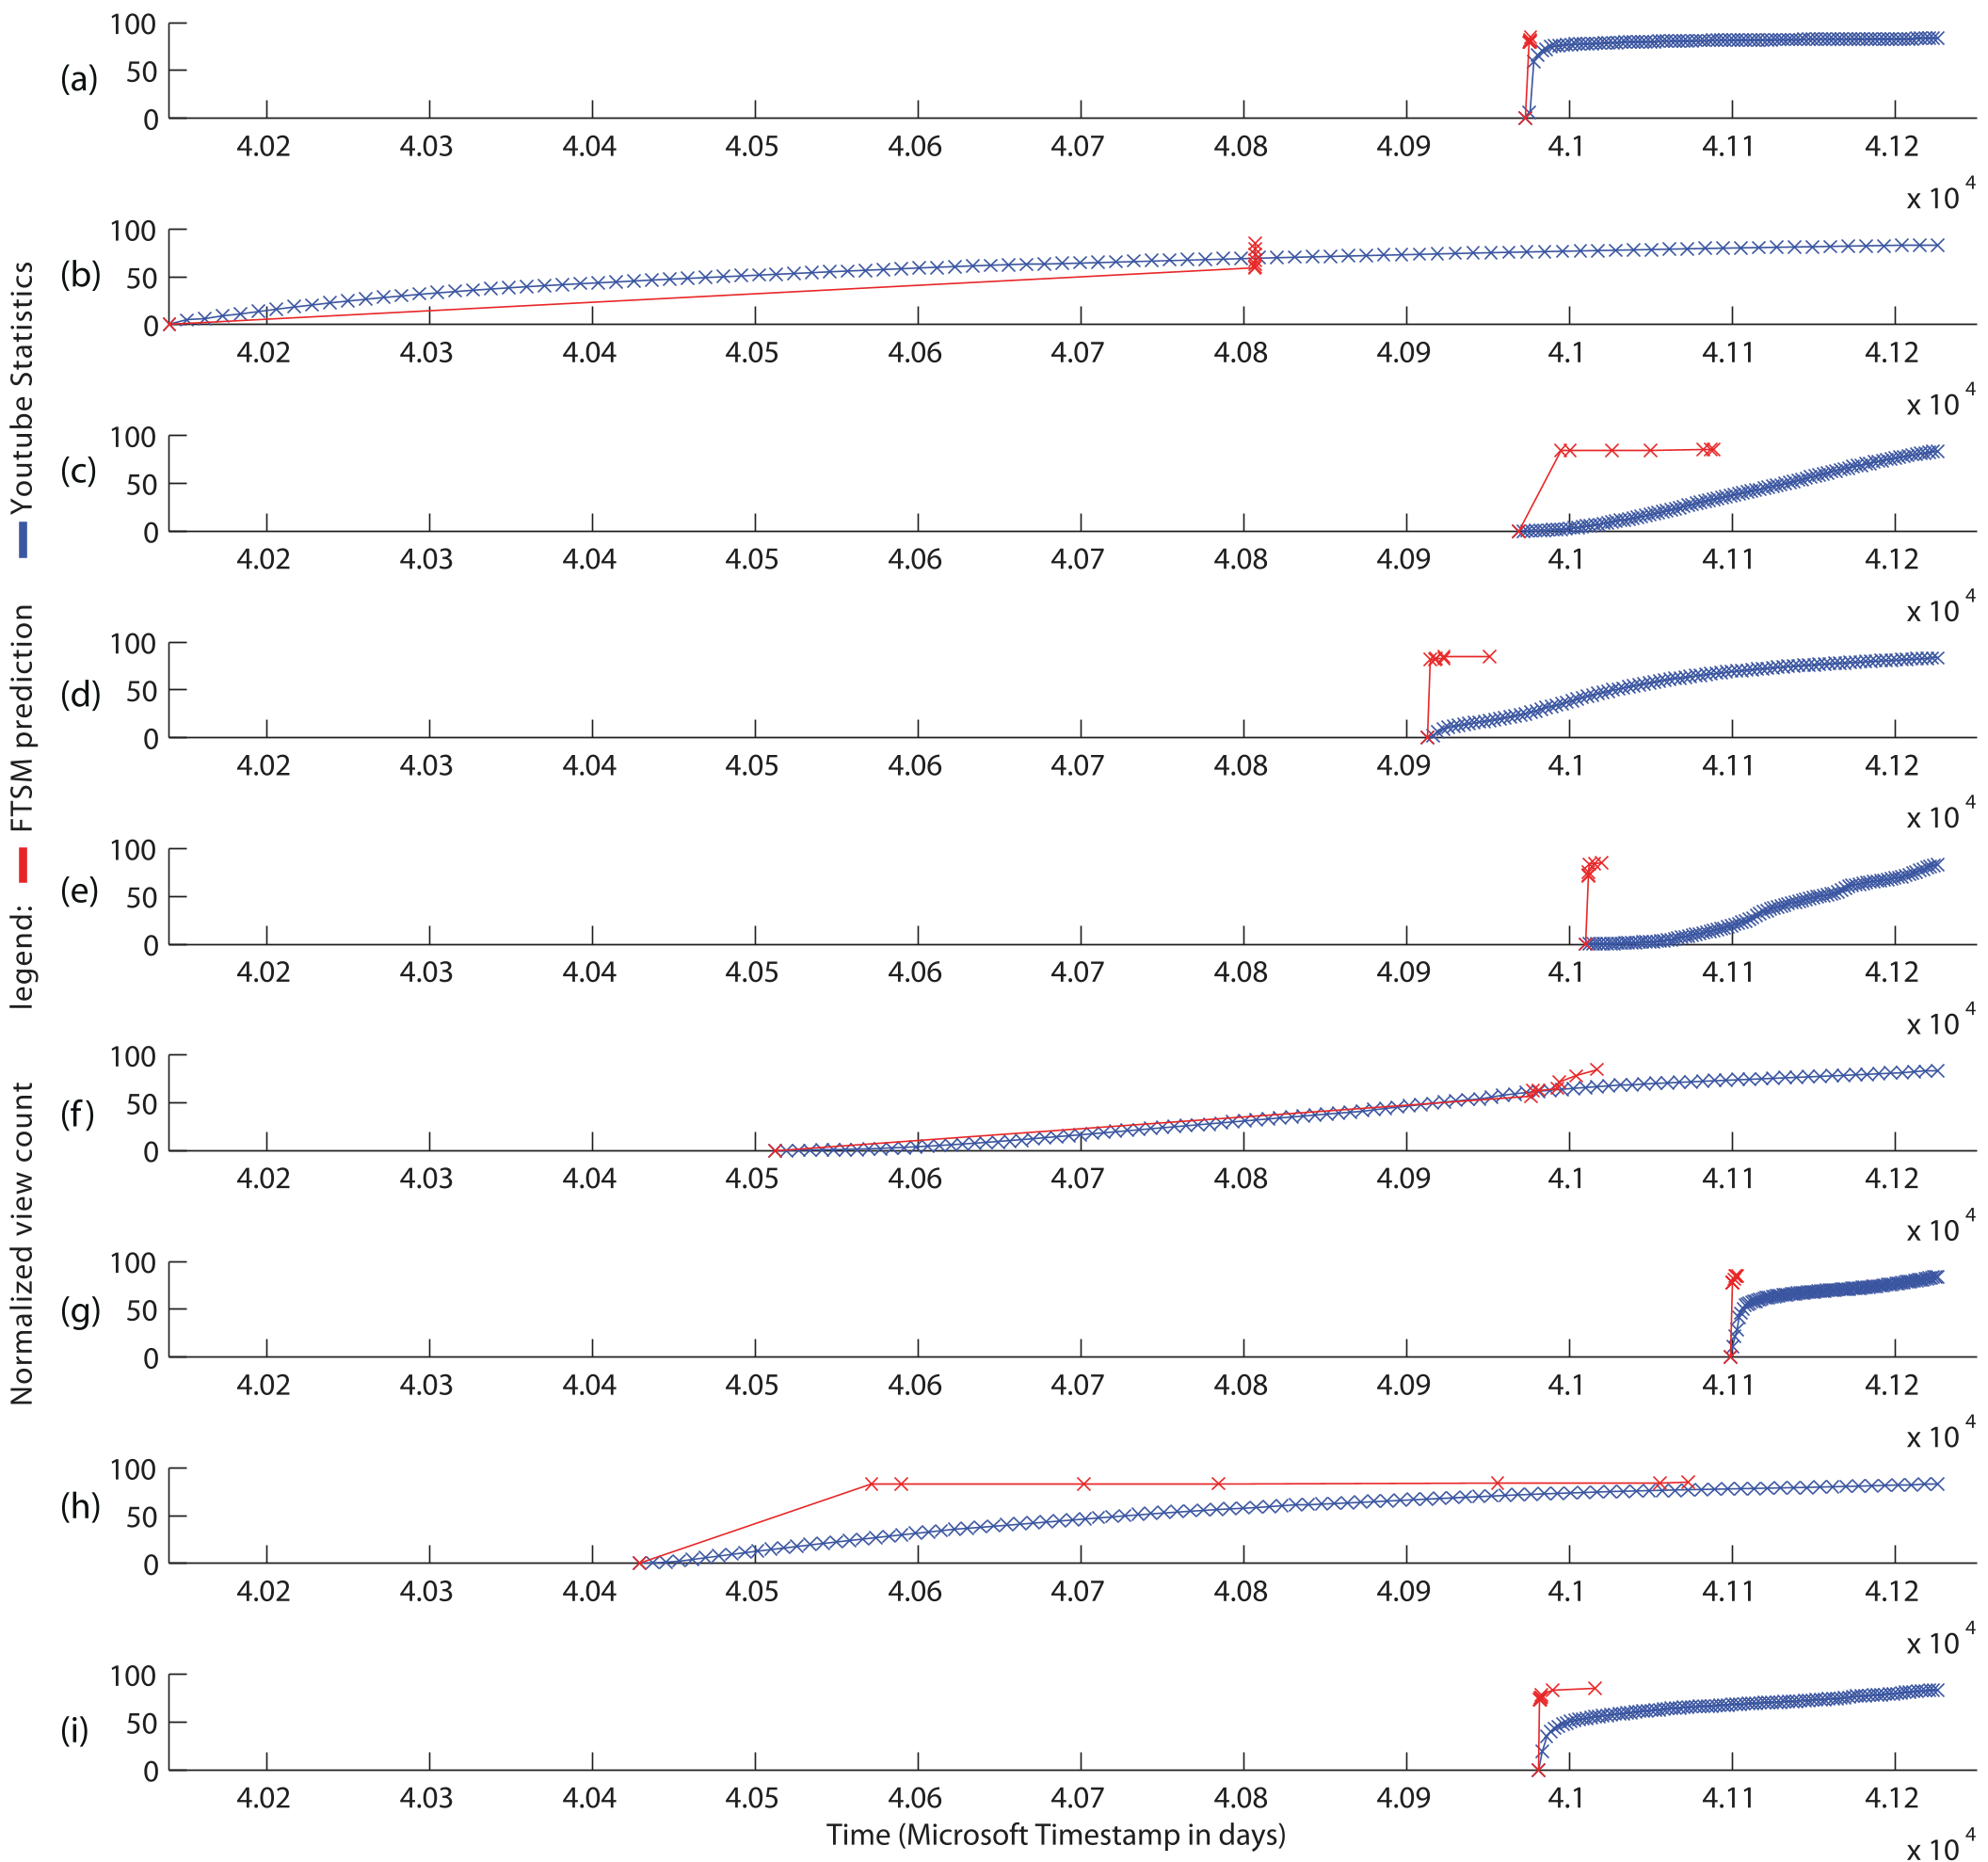 Fig 2: Normalized view counts. Note how the red FTSM curve typically rises before the blue YouTube curve, acting as a predictor.
Academic Insight: Why Small is Better
A significant part of the paper discusses Computational Complexity. For a network of a billion nodes, simulation is impossible in real-time. However, the authors argue—and demonstrate—that since social networks are "small worlds" with high clustering, observing a representative subgraph (the "Yellow Ellipse of Observation") is sufficient to predict global trends.
Conclusion & Future Work
The FTSM offers a practical bridge between social network theory and network engineering. By shifting from "What is popular now?" to "Who is sharing this now?", ISPs and CDNs can drastically improve user experience.
The next step for this research involves Parallel Partitioning: breaking large national populations into localized social subgraphs to optimize edge servers at the district level (e.g., allocating more cache to specific neighborhoods in Hong Kong based on local social ties).
Key Takeaway: The "social fabric" is the leading indicator of digital traffic. If you can map the network, you can predict the load.