
Decoding Social Tissue: High-Accuracy Tie Prediction from Bluetooth Proximity
Prediction of Social Ties Based on Bluetooth Proximity Time Series Data
This paper presents a method for inferring social ties using Bluetooth-enabled proximity time series data from the "Social Evolution" dataset. By leveraging supervised machine learning on temporal encounter patterns, the authors achieve a State-of-the-Art (SOTA) binary classification accuracy of 99% in distinguishing between the presence or absence of relationships.
TL;DR
Researchers have developed a method to reconstruct social networks using only Bluetooth proximity logs. By treating physical encounters as a time series and applying Principal Component Analysis (PCA), they achieved 99% accuracy in identifying whether two people are related, proving that physical behavior is a more reliable indicator of social ties than self-reported surveys.
Background: Beyond Self-Reported Links
In social science, "who you think you are friends with" often differs from "who you actually spend time with." This paper positions itself at the intersection of behavioral informatics and social computing, arguing that physical proximity is the most objective "proxy" for human relationships. Unlike previous studies that rely on intrusive call logs or SMS data, this work focuses exclusively on the temporal patterns of Bluetooth detections.
The Problem: Noise, Asymmetry, and Subjectivity
Existing methods for social link prediction face three major hurdles:
- Asymmetry: Device A might detect Device B, but B might not detect A due to hardware noise.
- Unbalanced Data: In most settings, "no relationship" accounts for over 70% of potential links, creating a bias in machine learning models.
- The "Bus Stop" Factor: Physical proximity doesn't always equal a social tie (e.g., strangers waiting for the same bus).
Methodology: Social Encodings and Temporal Heatmaps
The authors introduced Social Proximity Maps to visualize patterns of encounters. These heatmaps reveal distinct "rhythms" for different relationships:
- Close Friends: High frequency, mutual detections, and consistent temporal patterns.
- Political Discussants: High mutual detection but localized to specific timeframes.
The Two Core Encodings:
- Full Time Series (The "Brute Force" Approach): Capturing 8,065 sampling points. Using PCA, they reduced this to 790 highly significant dimensions that explain 75% of the variance.
- Encounters + Time (The "Feature Engineering" Approach): A compact 18-feature set dividing time into weekdays/weekends and sub-segments (Morning, Lunch, Afternoon, etc.).
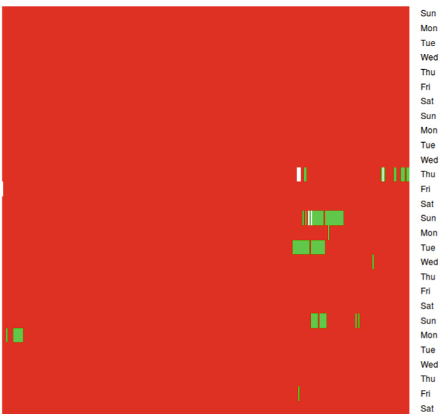 Figure 1: Comparison of encounter patterns between Close Friends (A), Socializing acquaintances (B), and Political Discussants (C).
Experimental Results: SOTA Performance
Using the MIT Social Evolution dataset, the study compared various classifiers including SVM, KNN, and PDA.
Key Findings:
- Binary Success: In "Relation vs. No-Relation" tasks, the Full Time Series achieved 99.9% accuracy with SVM (radial kernel) and PDA.
- The Power of Zero: A critical insight was that lack of encounters is just as informative as active encounters for defining social structure.
- Multi-modal Comparison: The authors outperformed previous benchmarks (e.g., EAGLE et al.) despite using fewer data sources, relying only on Bluetooth rather than a mix of cell towers and call logs.
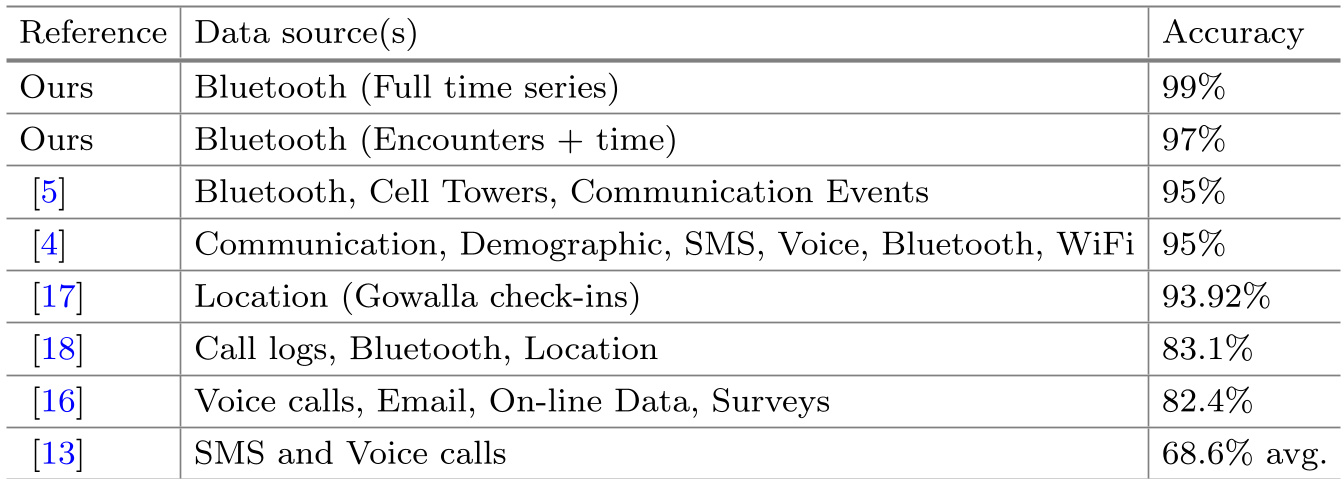 Table 1: The proposed Bluetooth-only method outperforms multi-source state-of-the-art models.
Critical Insight: Why Multiclass Fails
While the binary "Are they related?" question is solved, predicting the specific type of relationship (e.g., distinguishing a "Close Friend" from a "Work Colleague") remains difficult using proximity alone, with accuracies hovering around 30%. This suggests that while proximity proves a link exists, additional context (like communication content or sentiment) is likely required to define the nature of that link.
Conclusion & Future Outlook
This research demonstrates that we can "see" the skeleton of a social network through the lens of passive sensor data. Its significance extends beyond academia—from optimizing office layouts to refining epidemic contact-tracing algorithms. Future work will likely look into why specific timeframes (the 790 PCA-selected points) are so predictive, potentially uncovering hidden "social markers" in our daily schedules.