
Beyond Raw Percentages: Mastering Social Network Composition with Compositional SEM
Predictors and outcomes of social network compositions: A compositional structural equation modeling approach
The paper introduces a Compositional Structural Equation Modeling (SEM) approach using isometric log-ratio (ilr) transformations to analyze social network compositions. By integrating Multitrait-Multimethod (MTMM) designs, the authors achieve SOTA-level bias correction for measurement errors while strictly adhering to the geometric constraints of proportional data.
TL;DR
Analyzing social networks often involves looking at proportions—what percentage of your support comes from family versus friends? However, standard statistics break when applied to these "proportions of a total." This paper introduces a robust Compositional Structural Equation Modeling (SEM) framework. By using isometric log-ratio (ilr) transformations and Multitrait-Multimethod (MTMM) designs, the authors provide a way to analyze network changes that is mathematically sound, accounts for survey measurement errors, and delivers highly interpretable results.
The "Sum-to-One" Trap: Why Standard Analysis Fails
Most researchers treat the "percentage of friends" in a network as an independent variable. This is a mathematical fallacy. If the percentage of friends increases, the percentage of another group (like family) must decrease. This creates several "pathological" statistical issues:
- Spurious Correlations: Negative correlations appear simply because of the sum-to-one constraint.
- Restricted Space: Data is bounded between 0 and 1, violating the normality assumptions of OLS regression and standard SEM.
- Measurement Error: Survey data is notoriously "noisy," yet most compositional models assume the reported percentages are perfectly accurate.
The Methodology: Isometric Log-Ratios (ilr)
To solve this, the authors move away from raw proportions and toward log-ratios. Instead of looking at "percentage of partner," they look at the ratio of "partner vs. other family members."
Step 1: Transformation
The paper uses the ilr transformation, which creates a set of coordinates that are independent and lie in an unconstrained real space. For a network with four components (Partner, Family, Friends, Others), they construct three meaningful ratios:
- t1: Partner vs. Other Family
- t2: Friends vs. Other Non-family
- t3: Family vs. Non-family (Geometric means)
Step 2: The Structural Model
The authors embed these ratios into an SEM that includes:
- Predictors: Gender, Age, Education, and Extraversion.
- Outcomes: Tie Multiplexity (number of support functions) and Tie Strength (closeness).
- Measurement Error Correction: Using MTMM (Face-to-face vs. Telephone surveys) to strip away "method noise."
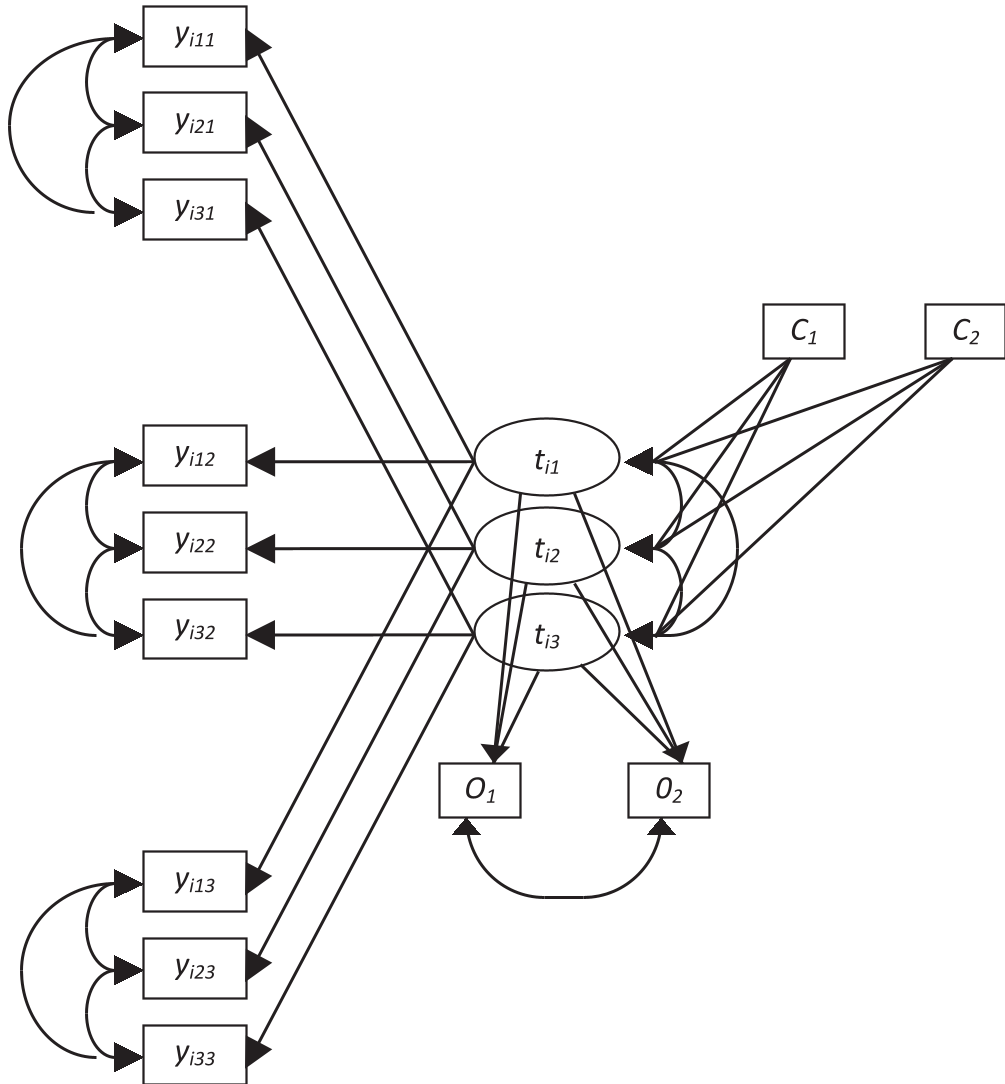 Figure 1: The conceptual SEM path diagram showing how covariates affect log-ratios, which in turn affect network outcomes.
Key Insights and Experimental Results
Using data from a representative sample of 1,033 inhabitants in Ljubljana, the study validated several long-standing sociological hypotheses with new precision.
1. The Predictors of Composition
- Gender: Women have a significantly lower partner-to-family ratio than men (Confirming that men rely more heavily on partners for support).
- Education: Higher education shifts the composition toward friends relative to other non-family members.
- Extraversion: Highly extraverted individuals naturally maintain a higher ratio of friends.
2. Composition and Life Outcomes
The study proved that how your network is composed directly impacts the quality of support:
- Multiplexity: A higher ratio of family to non-family (t3) and partner to family (t1) leads to "multiplex" ties—people who help you in multiple ways (Instrumental, Emotional, etc.).
- Closeness: The family-to-non-family ratio was the strongest predictor of overall tie strength (Standardized Coeff = 0.372).
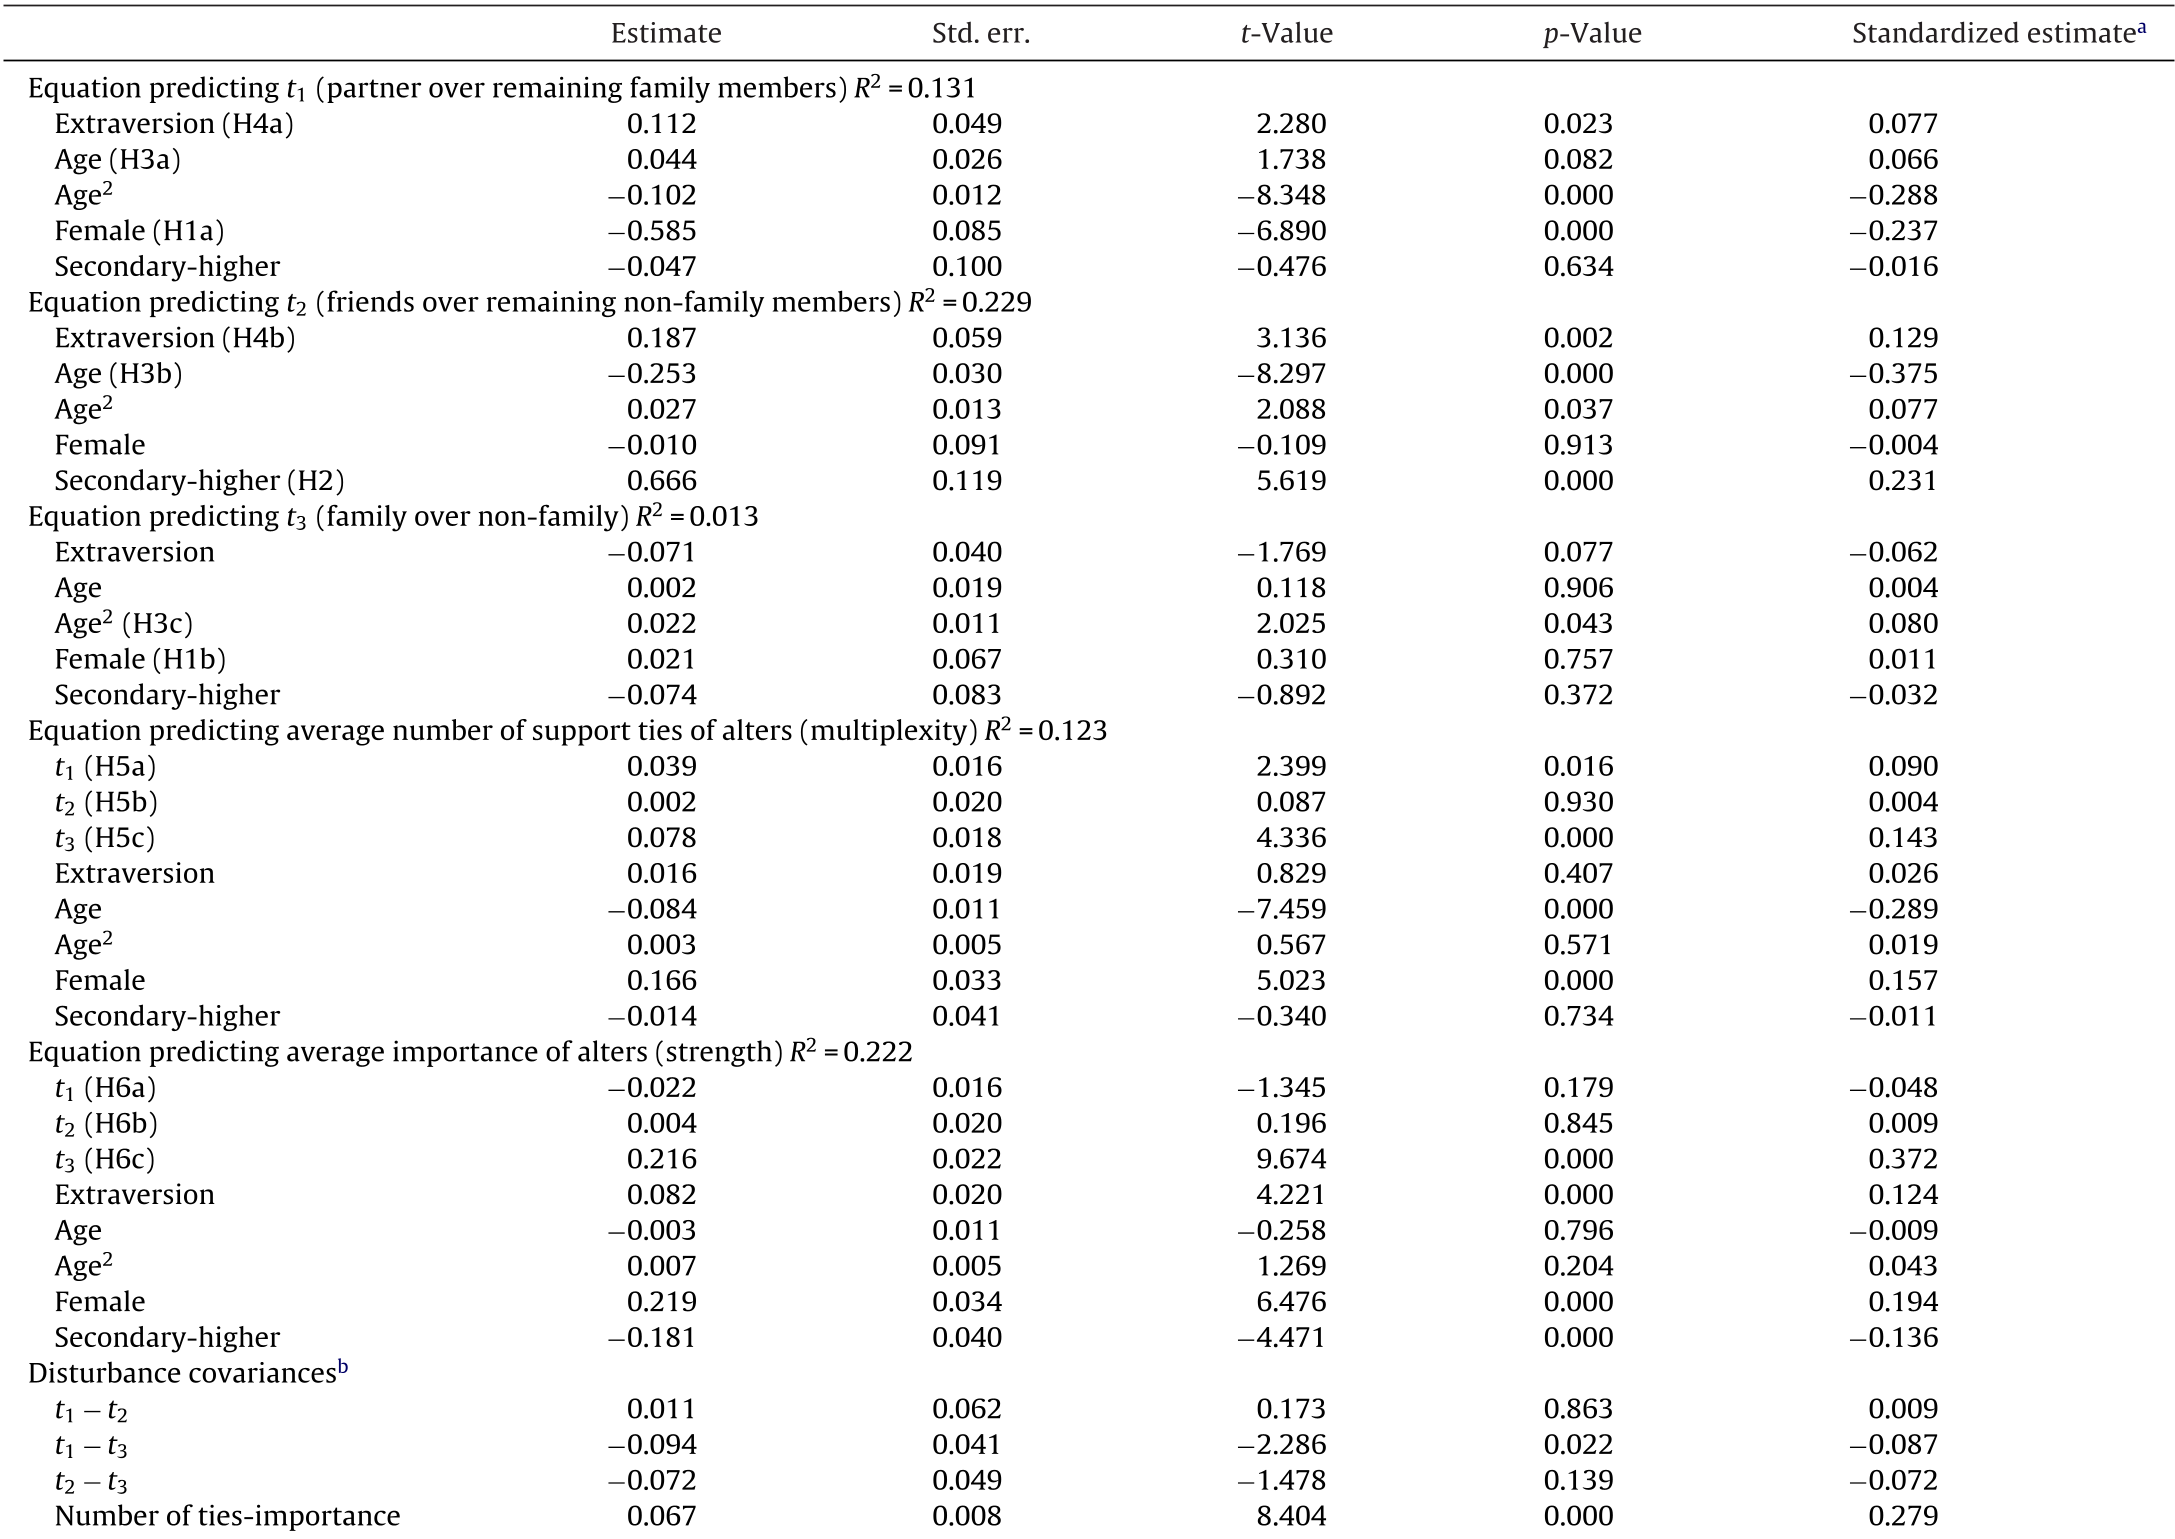 Table 1: Standardized estimates showing the impact of network ratios on multiplexity and strength.
Critical Analysis: Why This Matters
The true brilliance of this paper is the Interpretability-Geometric Harmony. Usually, log-ratio transformations are mathematically "pure" but impossible for a sociologist to explain. By carefully choosing the components of the ratios (e.g., comparing "Family" clusters vs. "Non-family" clusters), the authors made the math serve the theory.
Limitations
- Zeros: Dealing with "essential zeros" (e.g., people without partners) remains a challenge, often requiring researchers to drop those cases or use imputation.
- Granularity: The study didn't distinguish between "close friends" and "distant friends," which might have diluted the findings for certain hypotheses.
Future Outlook
This approach is a wake-up call for any researcher working with Compositional Data—whether it is time-use diaries, budget allocations, or social networks. Moving forward, the integration of these models into software like Mplus or R (compositions package) will allow for more nuanced, error-free social science.
Takeaway: Don't analyze the slice; analyze the ratio of the slices.