
Turning Data into Adoption: Identifying What Truly Drives Student Acceptance of Educational Data Mining
Identifying priority antecedents of educational data mining acceptance using importance-performance matrix analysis
2019-01-04
Summary
Problem
Method
Results
Takeaways
Abstract
This study develops an integrated framework for Educational Data Mining (EDM) acceptance by combining the Technology Acceptance Model 3 (TAM3) and the Technology Readiness Index (TRI). Utilizing Importance-Performance Matrix Analysis (IPMA), it identifies Perceived Usefulness (PU) and Perceived Ease of Use (PEOU) as the primary drivers of EDM adoption among undergraduate students.
## TL;DR
While Educational Data Mining (EDM) offers powerful predictive capabilities for student success, its actual adoption depends on human psychology rather than just algorithmic accuracy. This study identifies **Perceived Usefulness (PU)** and **Perceived Ease of Use (PEOU)** as the "VIP" factors that determine whether students embrace or abandon these tools.
## The Human Side of the Algorithm: Motivation & Context
Data mining has long been the backbone of business intelligence, but its transition into the classroom—as Educational Data Mining (EDM)—faces unique hurdles. Most research focuses on the "how-to" of the algorithms (e.g., Bayes theorem, Random Forests). However, the authors argue that the technical perfection of a model is irrelevant if the end-users (students) are hesitant to use the interface or trust the output.
The core challenge is that students often feel EDM is "complex and beyond their scope." To address this, the researchers looked beyond technical metrics to explore the **Inductive Bias** of the users themselves: what psychological levers must be pulled to turn a skeptical student into a proactive user?
## Methodology: The Fusion of TAM3 and TRI
The study employs a robust hybrid model combining two pillars of behavioral science:
1. **TAM3 (Technology Acceptance Model 3)**: Focuses on cognition (usefulness/ease of use) and control beliefs (self-efficacy).
2. **TRI (Technology Readiness Index)**: Focuses on an individual's mental predisposition (optimism vs. insecurity).
### The Analysis Pipeline
The authors utilized **PLS-SEM** (Partial Least Squares Structural Equation Modeling) to validate 11 hypotheses. But the real "secret sauce" here is the **IPMA (Importance-Performance Matrix Analysis)**. Unlike standard path analysis which only tells you if a relationship exists, IPMA tells you how much impact a variable actually has compared to how well it is currently performing.
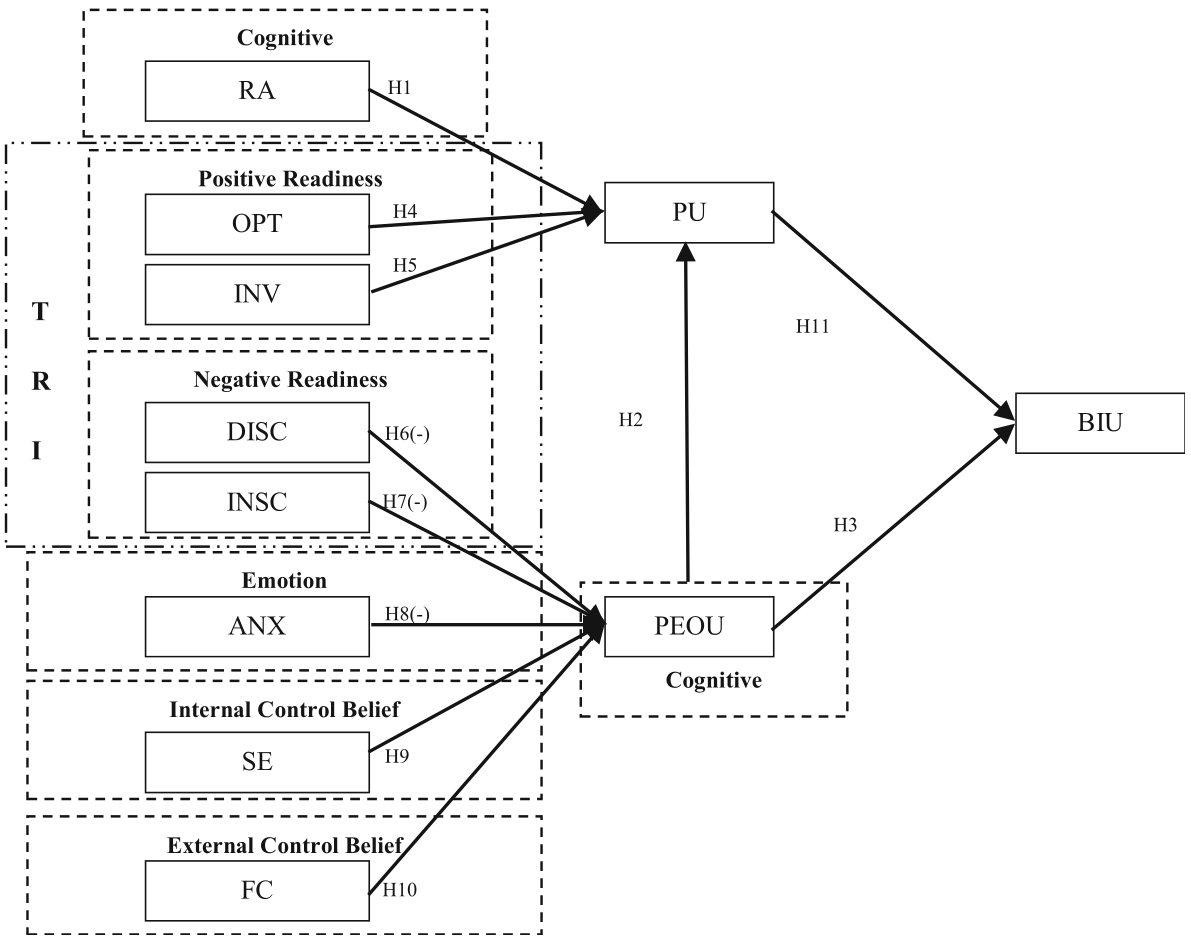
*Figure 1: The conceptual model integrating psychological and readiness antecedents.*
## Key Insights: What the Data Revealed
The study analyzed 211 valid responses from Malaysian undergraduate students. The results were telling:
* **The Utility King**: Perceived Usefulness (PU) had a total effect of 0.605 on Behavioral Intention. Students care most about whether the tool will actually help them graduate with better grades.
* **Ease is Expected**: Perceived Ease of Use (PEOU) was the second most important factor. If the UI is clunky, the adoption dies.
* **The Optimism Boost**: Optimism (OPT) was the strongest driver among the "Readiness" factors, suggesting that students who believe technology offers better control are much more likely to engage with EDM.
* **What Didn't Matter?**: Surprisingly, **Innovativeness (INV)** and **Anxiety (ANX)** were insignificant. This implies that "being a tech-enthusiast" or "being afraid of tech" matters less than the tool's practical value.
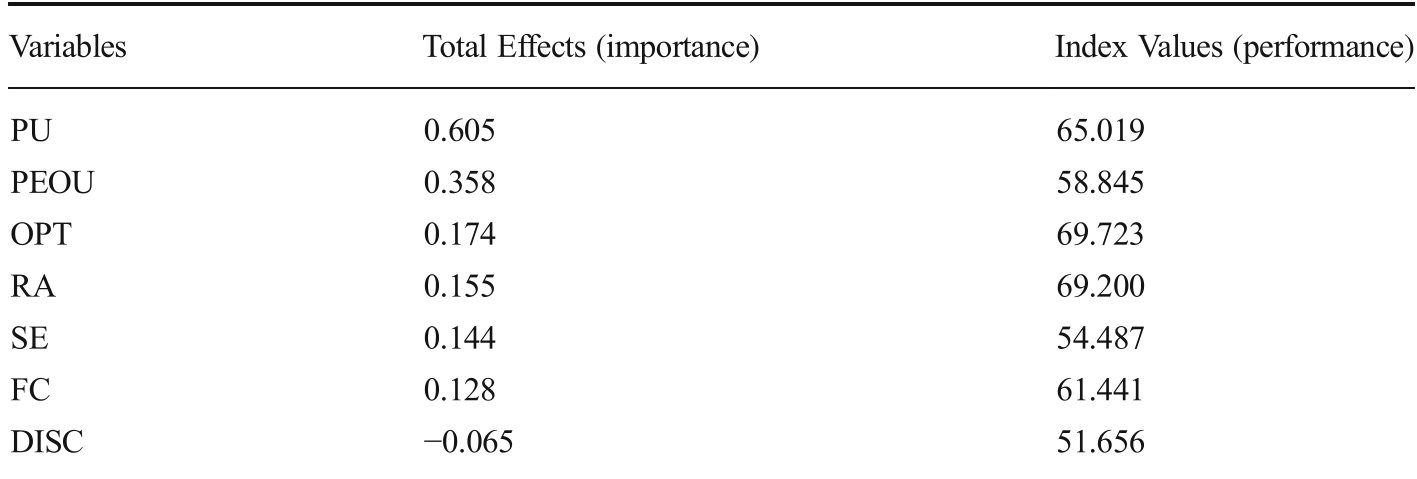
*Table 1: IPMA results showing the hierarchy of Importance vs. Performance.*
## Critical Analysis & Future Outlook
The study successfully shifts the focus from "the model" to "the user." Its use of IPMA provides a practical roadmap for university administrators: **don't just buy the most accurate software; buy the one that students find most useful and least frustrating.**
### Limitations & Future Work
* **Demographic Bias**: The study is concentrated on Malaysian undergraduates. Results might shift in different cultural contexts (e.g., Western vs. Eastern learning styles).
* **Complexity of Needs**: As EDM evolves into Generative AI and automated tutoring, the "Trust" factor (Insecurity) may become more critical than it was in this 2019 study.
* **Stakeholder Comparison**: Future research should apply this IPMA lens to educators and administrators, whose "Priority Antecedents" likely differ from those of students.
## Final Takeaway
For EDM to move from a niche research interest to a ubiquitous educational tool, the industry must solve the **User Experience (UX) gap**. The most powerful predictor is not the one with the highest F1-score, but the one that the student perceives as their most valuable academic ally.