
PLSS Modeling: Decoding Social Isolation in Super-Aged Societies through Spatial Semantics
Analyzing regional characteristics of living activities of elderly people from large survey data with probabilistic latent spatial semantic structure modeling
The paper introduces Probabilistic Latent Spatial Semantic (PLSS) Modeling, a framework combining pLSA and Bayesian Networks to analyze regional living activities of the elderly. Applied to Japan's JAGES survey data (74k+ records), it successfully identifies 25 distinct regional clusters and maps social network disparities across geographic areas.
TL;DR
As global populations age, understanding the geographical distribution of elderly "social health" is crucial. This paper presents Probabilistic Latent Spatial Semantic (PLSS) Modeling, a hybrid machine learning approach that transforms raw questionnaire data from over 74,000 elderly residents in Japan into actionable spatial insights. By combining pLSA (for clustering) and Bayesian Networks (for causal reasoning), the researchers proved that physical neighborhood infrastructure—like parks and "walk-in" facilities—directly influences the social vitality of a region.
Context & Motivation: The Looming Crisis of Isolation
Japan stands at the vanguard of the "super-aged society" challenge. While large-scale surveys like the JAGES (Japan Gerontological Evaluation Study) provide a wealth of data, traditional statistical methods often struggle to bridge the gap between "what" is happening and "where/why" it is happening.
The authors identified a critical technical bottleneck: when dealing with massive survey data, the resulting contingency tables become extremely sparse, making standard Bayesian analysis unreliable. To solve this, they propose a "clustering-first" approach to group postal codes with similar response profiles before attempting to build a causal graph.
Methodology: The PLSS Pipeline
The PLSS framework is a three-tiered analytical engine:
- Spatial Aggregation: Survey responses are tied to postal codes, turning individual data into "regional documents."
- Dimensionality Reduction via pLSA: Using the EM (Expectation-Maximization) algorithm, the model identifies latent variables () that explain the co-occurrence of specific answers and specific postal codes.
- Causal Graphing with Bayesian Networks: These latent clusters are then treated as nodes in a Bayesian Network, allowing researchers to perform "What-if" simulations.
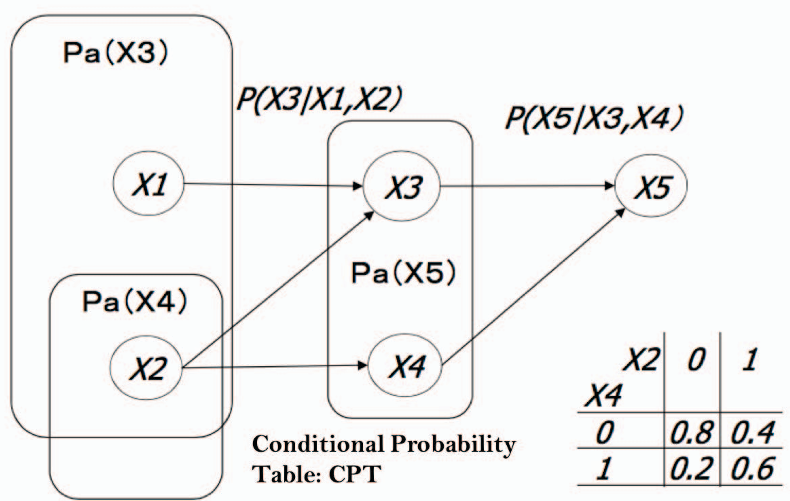 Figure 1: The JAGES survey captures multifaceted data points including hobbies, social networks, and proximity to neighborhood facilities.
Key Insights: Mapping the "Social Fabric"
The study extracted 25 latent clusters (determined by minimizing AIC). By mapping these onto the city of Nagoya, a clear pattern emerged: social behavior is geographically correlated. Neighboring areas tended to belong to the same clusters, suggesting that the "environment" is a stronger driver of behavior than previously thought.
- Cluster Z003/Z009: High activity in hobbies (golf, painting) and strong social ties.
- Cluster Z025: High levels of isolation, characterized by "None" in frequency of meeting friends and lower participation in hobby groups.
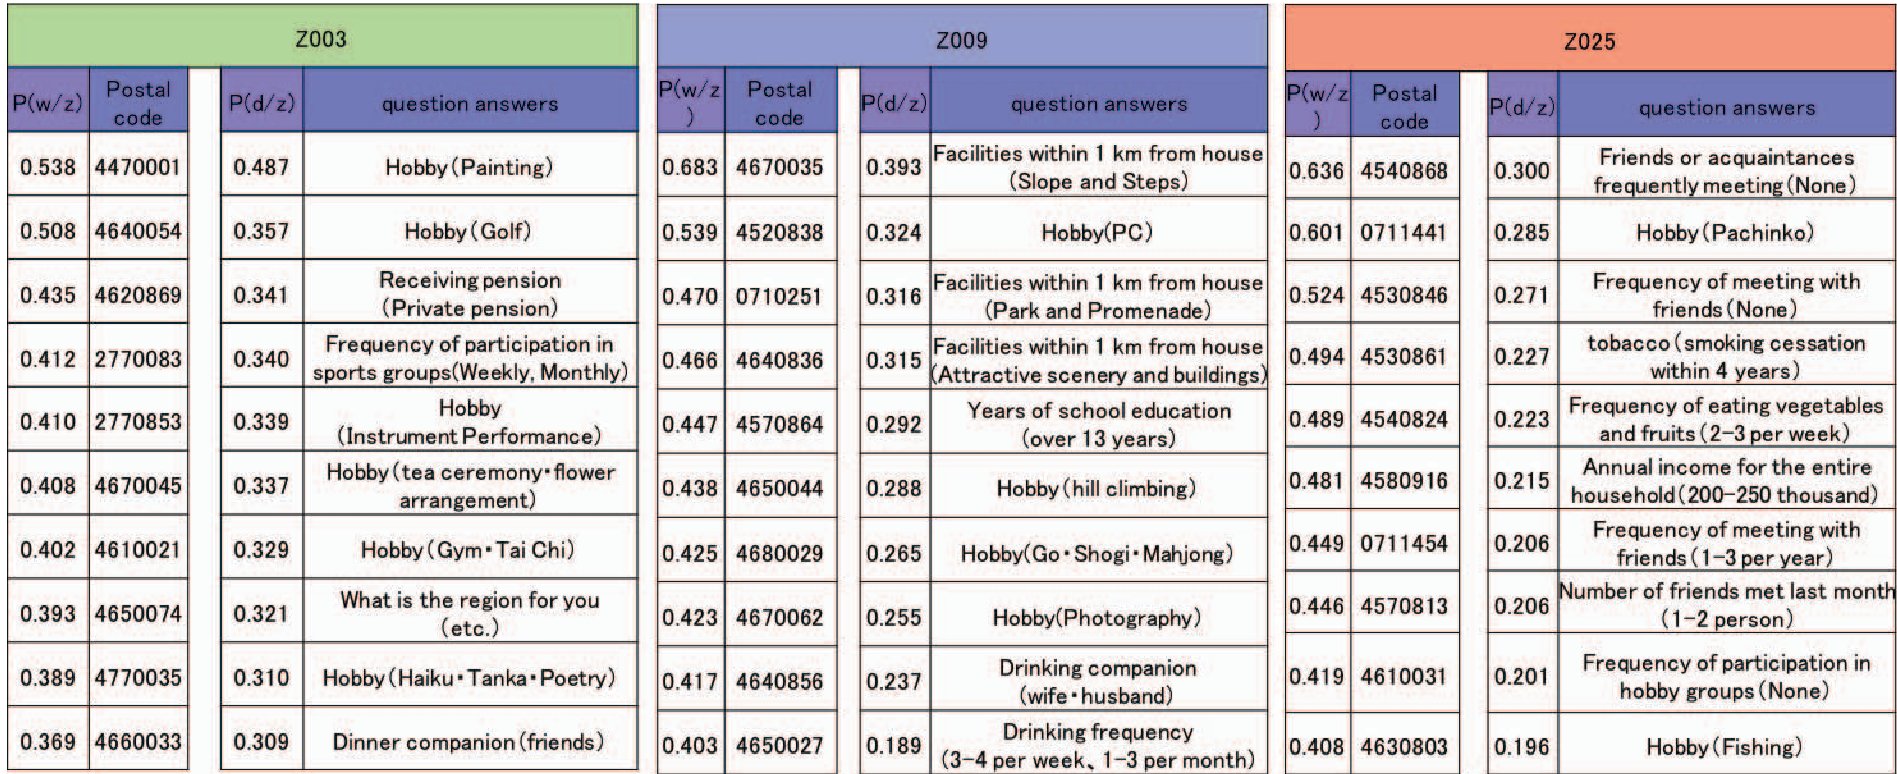 Table 1: Probability distributions showing the strongest associations between specific postal codes and social behaviors.
Causal Reasoning: Can We "Design" Better Communities?
The most powerful application of the Bayesian Network was the Top-Down inference. The researchers simulated a "Regional Intervention" scenario.
The Hypothesis: If a local government increases the number of "houses and facilities that you can drop in casually within 1 km," what happens to local communication?
The Result: The probability of "Increase of local communication and activity" jumped from 3.7% to 19.8%. This provides a quantitative justification for urban planning projects like community centers and parks.
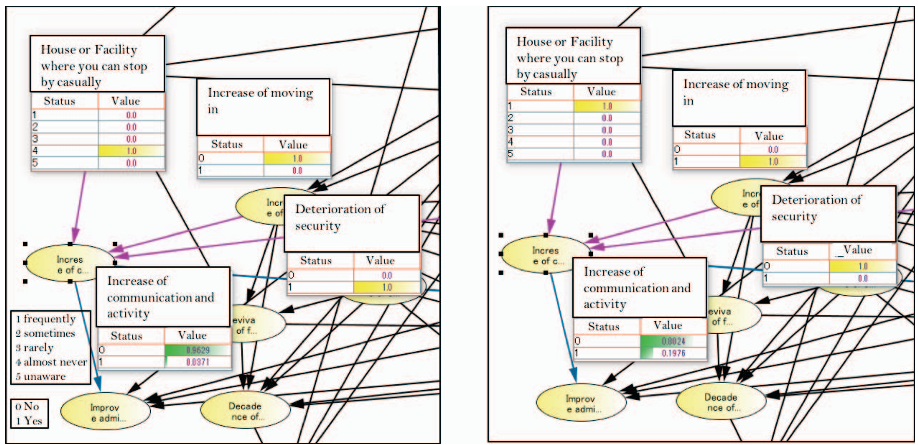 Figure 2: Causal propagation showing how neighborhood facilities influence regional change and social revitalized.
Critical Perspective & Future Outlook
While the PLSS model is highly effective for clustering and qualitative reasoning, the authors noted limitations in predicting individual health outcomes (like dementia or mortality). This was due to "imbalanced data"—the number of certified care-needing individuals is much smaller than the healthy population, leading to low recall for the "at-risk" class.
Takeaway for the Industry: This work shifts the focus from "treating the individual" to "treating the region." For tech companies and urban planners building "Smart Cities," this model provides a framework to treat neighborhood amenities as "social catalysts" rather than just infrastructure. Future iterations utilizing undersampling and time-series data will likely refine these causal links even further.
Conclusion
The integration of spatial semantic structures with causal graphs marks a significant step forward in computational social science. It transforms static survey data into a dynamic simulation tool, allowing us to see not just the current state of our aging population, but the potential future created by intentional regional design.