
Modeling the Blur: A Probabilistic Approach to Emotion Perception
Formulating emotion perception as a probabilistic model with application to categorical emotion classification
This paper introduces a probabilistic framework for Categorical Emotion Classification by modeling emotional perception as a latent multivariate Gaussian distribution. The core method, Soft Label from the Expected Intensity of Emotion (SL-EIE), treats human annotations as samples from this distribution to derive superior soft labels for training Deep Neural Networks (DNNs).
TL;DR
In the realm of Affective Computing, "ambiguity" is usually treated as noise. This paper argues it is a feature. By modeling the human perception of emotion as a multivariate Gaussian distribution, the authors develop a method called SL-EIE that outperforms traditional majority-vote systems. Instead of asking "What is the label?", they ask "What is the underlying intensity distribution that led to these conflicting labels?"
Background: The Subjectivity Trap
When three people hear a recording, one might say the speaker is "Angry," another says "Disgusted," and the third says "Frustrated." Standard Machine Learning (ML) pipelines typically use Majority Vote to pick one winner, discarding the others as "noise." This "Winner-Takes-All" strategy is fundamentally flawed because:
- It ignores the shades of emotion (e.g., high-arousal vs. low-arousal happiness).
- It fails to recognize that some emotions are physiologically and acoustically related (Anger/Disgust), while others are distinct (Sadness/Happiness).
Methodology: Perception as a Random Variable
The authors propose that for every speech segment, there exists an unobservable intensity vector . When a human rater evaluates the clip, they are essentially sampling a point from a hidden Gaussian distribution .
1. The Core Intuition
If a rater chooses "Anger," it simply means that in their specific sample of the clip's emotional state, the "Anger" dimension had the highest intensity. By looking at the distribution of choices across multiple raters, we can reverse-engineer the Mean Intensity () of that specific clip.
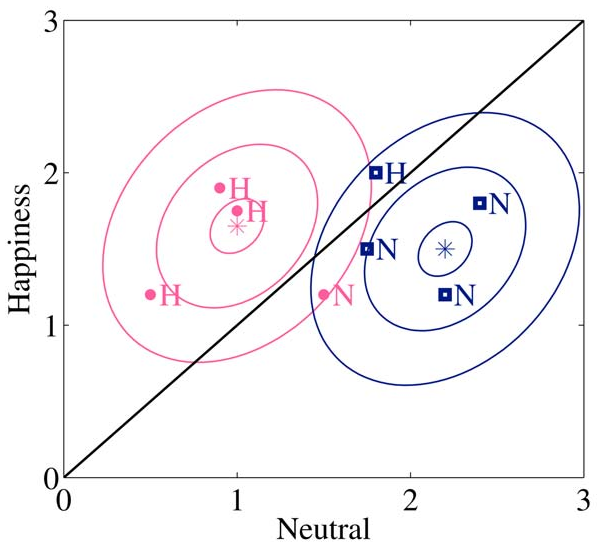 Figure 1: Visualizing perception. The boundary determines which emotion a rater reports. The goal is to estimate the red and blue Gaussian clouds from these discrete reports.
2. Capturing Relationships via Covariance
Unlike standard cross-entropy which treats all classes as equidistant, this model uses a Covariance Matrix ().
- Positive Correlation: If "Anger" and "Disgust" have a positive covariance, a mistake between them is penalized less.
- Negative Correlation: "Happiness" and "Sadness" are effectively opposites; confusing them yields a much higher loss.
The matrix shown in the paper (Table 1) confirms this: Neutral and Happiness show a strong negative correlation (-0.25), indicating they are perceptually distinct in the MSP-PODCAST dataset.
Experimental Results
The researchers tested their framework using a DNN on the MSP-PODCAST dataset (21+ hours of spontaneous speech).
Key Performance Metrics
| Method | F1-Score | Improvement |
|---|---|---|
| Majority Vote (Baseline) | 24.9% | - |
| Fayek et al. Soft-labels | 25.3% | +0.4% |
| SL-EIE (Proposed) | 26.2% | +1.3% |
While a 1.3% absolute gain might seem modest, in the highly subjective 7-class problem of spontaneous speech (where human agreement is only ~39.6%), this is a statistically significant leap.
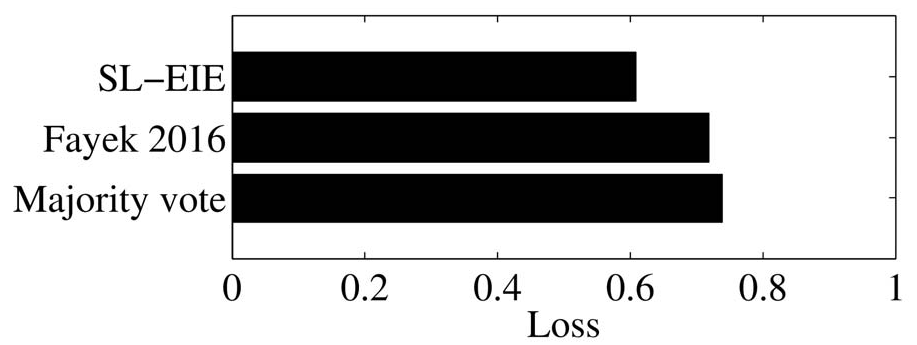 Figure 2: The proposed SL-EIE significantly reduces the average loss compared to both hard-label and existing soft-label methods.
Critical Insight: Why Does This Work?
The real "magic" happens in Algorithm 1. By adjusting the mean vector iteratively to match the observed probability of an emotion being selected, the model forces the DNN to learn the underlying emotional manifold.
Moreover, the use of the Mahalanobis-based loss function is a masterstroke. It acknowledges that in human-computer interaction, calling a "Sad" person "Neutral" is a minor error, but calling a "Sad" person "Angry" is a catastrophic failure of empathy. The covariance-weighted loss encapsulates this social logic directly into the gradient descent process.
Limitations & Future Work
- Universal Covariance: The study assumes one for all sentences. In reality, some speakers might have "Angry-sounding Neutral" voices (idiosyncratic covariance).
- Sparse Labels: With only 5 raters per clip, estimating a 7D distribution is "thin." The authors' use of a factor to account for unseen labels is a clever patch, but more robust Bayesian priors might be needed.
Conclusion
This paper represents a shift from Labeling to Modeling. By treating human disagreement as a signal of emotional intensity rather than an error to be averaged away, the SL-EIE framework moves us closer to AI that understands the nuanced, blended nature of real-world human affect.