
Designing Digital Inclusion: Why Household Profiles Matter More Than Infrastructure
Public policies based on social networks for the introduction of technology at home: Demographic and socioeconomic profiles of households
This paper analyzes the digital divide in Spanish households by developing a Regional ICT Development Index (RIDI) and a Discriminate Regional Index (DIRIDI). It utilizes cluster analysis to categorize Spanish regions and identifies key socio-demographic factors—such as household size, municipality type, and age—that drive technological adoption.
TL;DR
Access to the internet is no longer just about cables and satellites; it’s about who lives at home and how they learn. This research moves beyond national averages to reveal how household size, age, and municipality type create a "Discriminating Index" for the digital divide in Spain. By clustering regions based on ICT Use and Skills, the authors argue for public policies rooted in social network externalities and collaborative learning.
The "One-Size-Fits-All" Trap
For years, policy makers believed that if you build the broadband, they will come. However, the "Digital Divide" persists as a source of inequality, particularly for underprivileged households. The authors point out a critical flaw in current strategies: they ignore the household profile. Why does a four-person household in Madrid have better digital outcomes than a similar one in Extremadura? The answer lies in the intersection of socio-economic status and regional development.
Methodology: From RIDI to DIRIDI
The researchers didn't just look at who has a computer. They adapted the United Nations' ICT Development Index (IDI) into a specialized Regional ICT Development Index (RIDI) for Spain.
The real innovation, however, is the Discriminate Regional ICT Development Index (DIRIDI). By breaking down indicators—like e-administration use and e-commerce participation—and applying a Student’s t-test, they isolated only the variables where regions showed statistically significant differences.
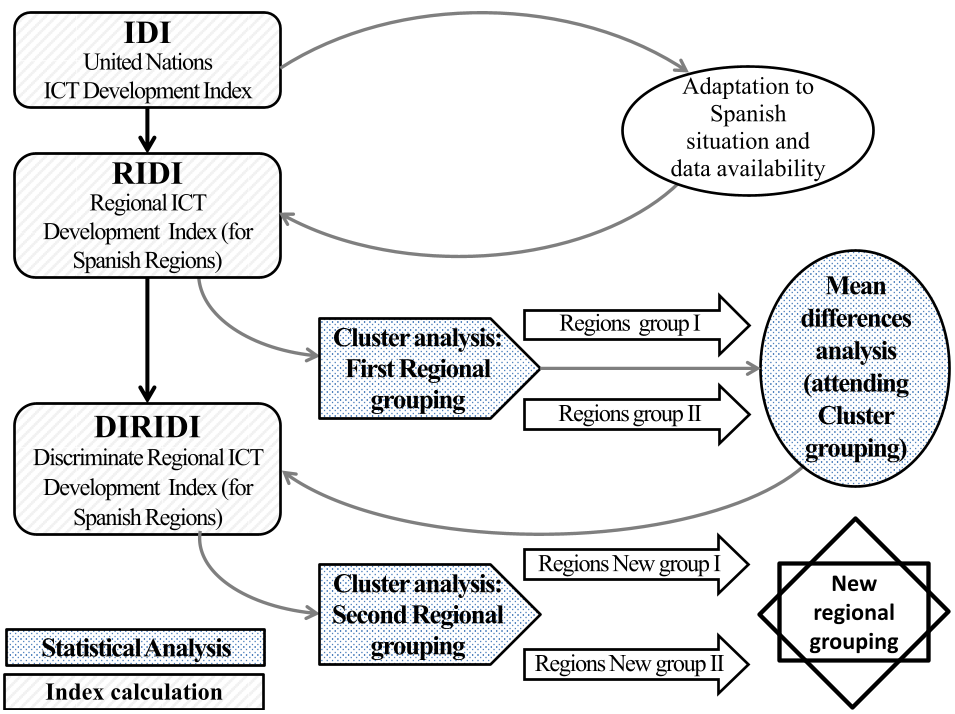 Figure 1: The dimensions of technological inclusion: Technical Access, Economic Access, and Skills/Knowledge.
The Great Spanish Polarization
The paper reveals a stark geographic divide. The Northeast and Mediterranean areas (Madrid, Basque Country, Catalonia) form a high-performance cluster, while the peripheral regions (Extremadura, Castile-La Mancha) struggle.
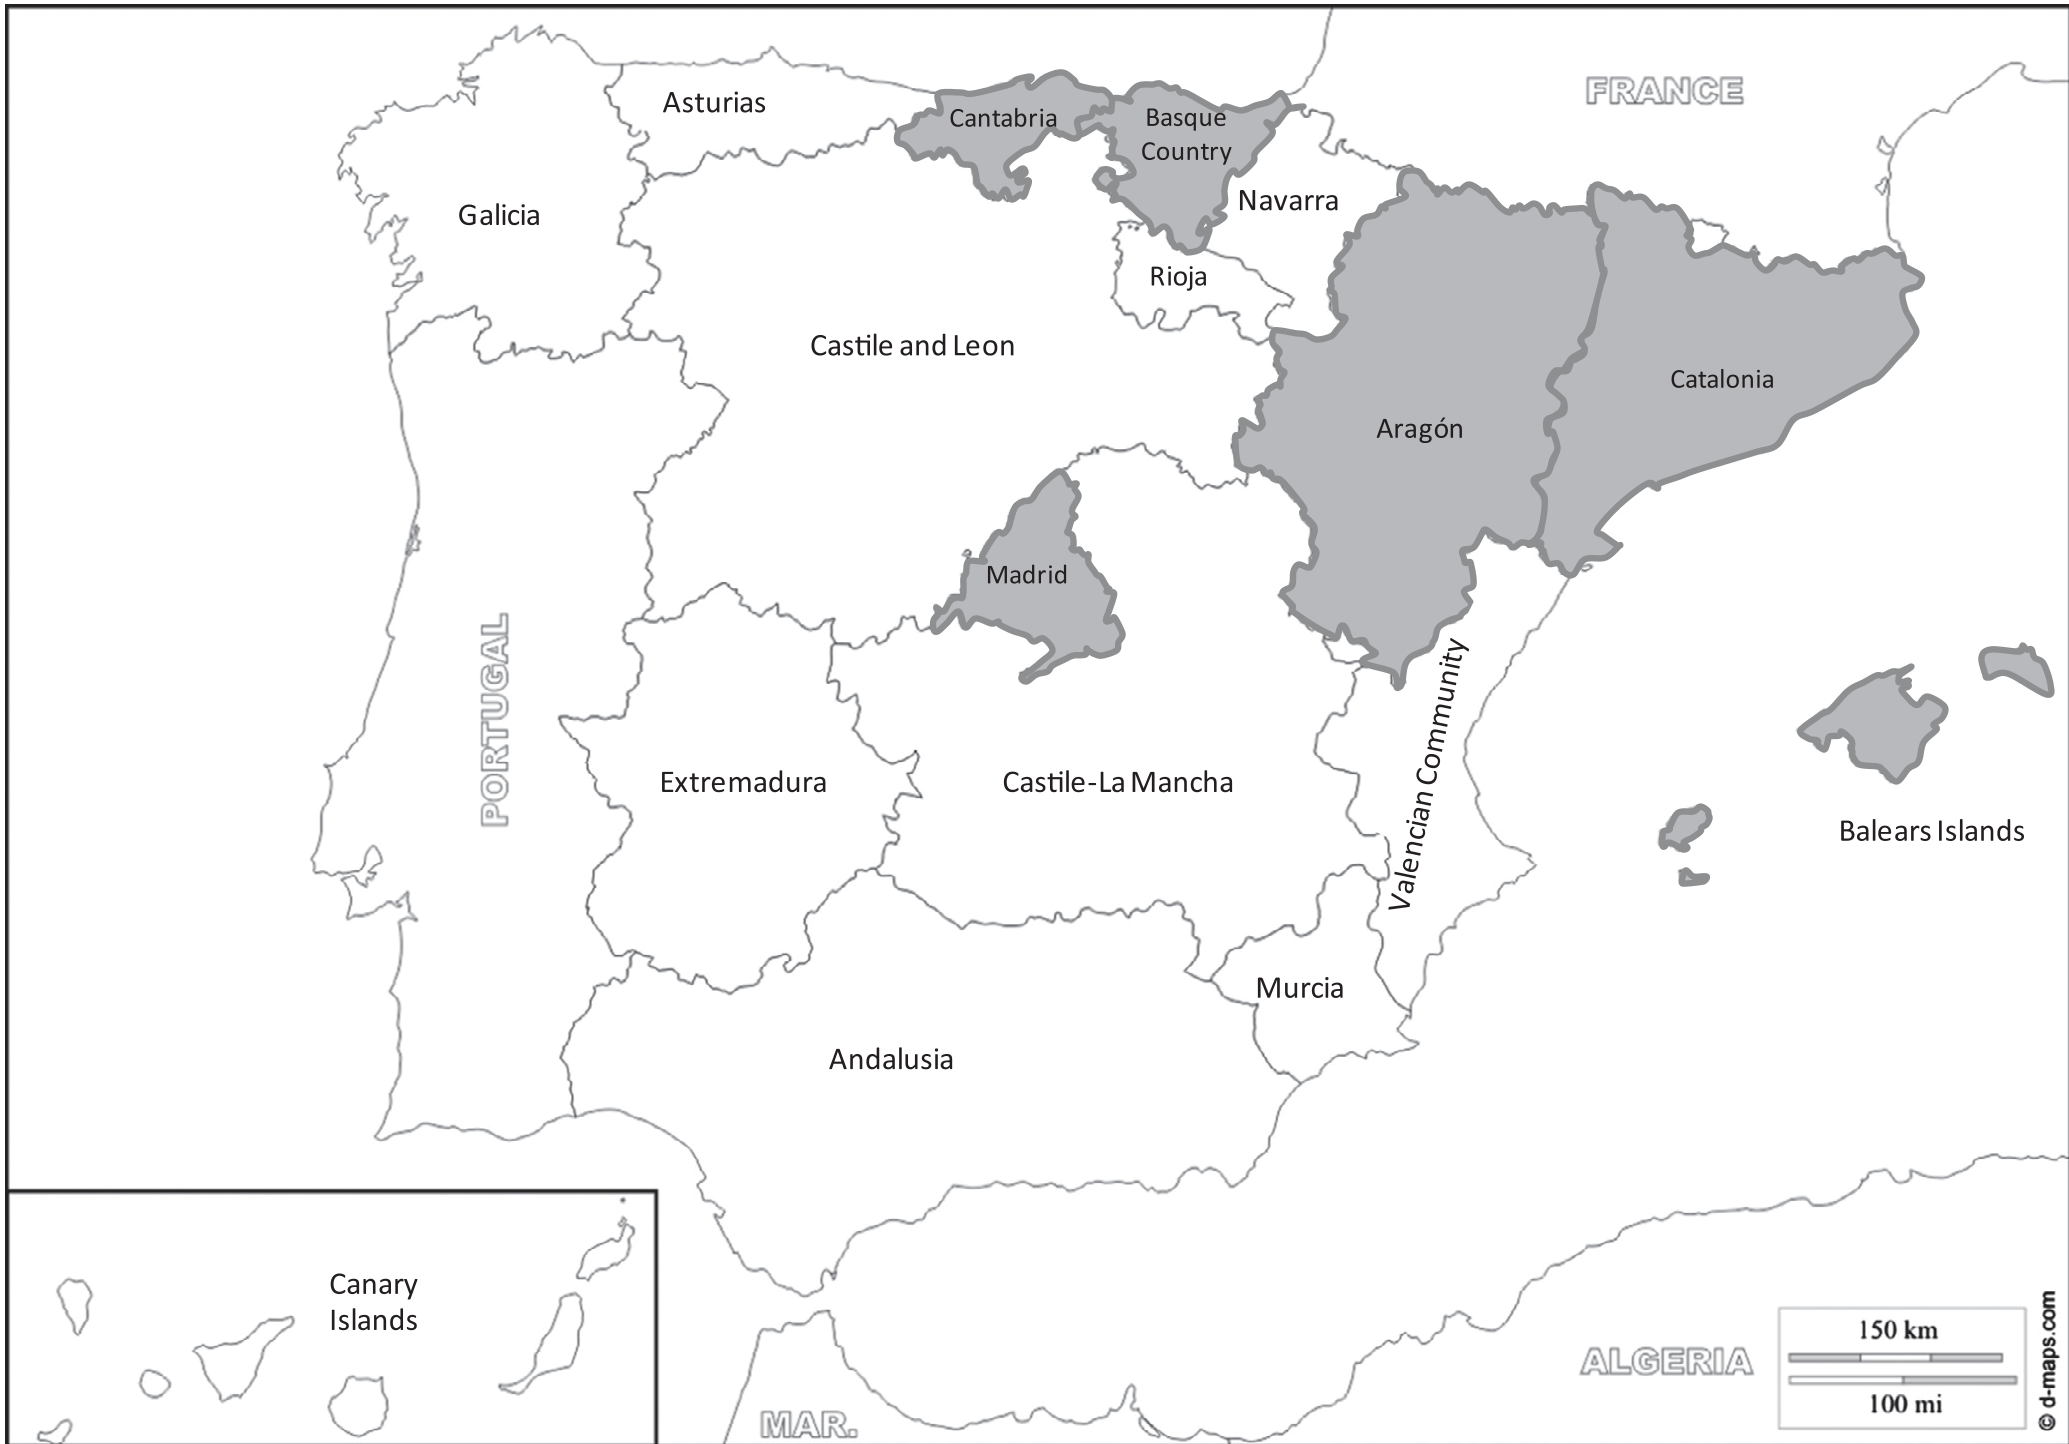 Figure 2: Geographical distribution of ICT development clusters in Spain, showing the North-East advantage.
Key Findings in the Data:
- Household Size & Age: Young, single-person households show similar digital habits across all regions. The divide widens in larger family units and among those over 55.
- Skills vs. Access: While mobile phone penetration is nearly universal (no significant difference between clusters), the Skills sub-index (e-commerce, e-gov) remains the weakest link across the board.
- The "Navarre" Shift: When using the discriminate DIRIDI index, the region of Navarre jumped into the top-tier cluster, proving that specific socio-economic conditions can decouple a region's digital success from its neighbors.
Strategic Insight: The Power of Networks
The authors lean heavily on the concept of Network Externalities. Technology is like a social network—it becomes more valuable as more people join. If a household believes the internet is "not useful" (a primary reason listed for lack of access), the solution isn't a faster cable; it's a social intervention.
Policy Recommendations:
- Collaborative Learning: Use local social hubs to teach ICT skills, leveraging the "multiplier effect" of social networks.
- Targeted Demographics: Focus on municipalities with fewer than 10,000 people and households with members aged 55+.
- Beyond Connectivity: Focus on "Skills" (Sub-index 3), as this is where even the most developed regions lag.
Conclusion: A Future of Digital Welfare
The digital divide is a moving target. As the paper demonstrates, inequality is no longer just about having the tool, but having the capacity to use it for economic and social advancement. By identifying the specific household profiles that are "falling behind," policy makers can move from building infrastructure to building digital citizens.
Takeaway: The "Northeast" advantage in Spain isn't just a matter of wealth—it's a matter of social and educational ecosystems that foster ICT skills. Future research should look deeper into the types of social networks that most effectively bridge these gaps.