
Bridging the Gap: A Holistic QoS/QoE Evaluation of Mobile Data in Addis Ababa
Quality Evaluation for Indoor Mobile Data Customers in Addis Ababa Business Area Using Data from Network Management System, Walk Test, Crowdsourcing and Subjective Survey
This paper presents a comprehensive Quality of Experience (QoE) and Quality of Service (QoS) evaluation for UMTS (3G) indoor mobile data services in Addis Ababa, Ethiopia. It uniquely combines data from four distinct sources: Network Management System (NMS), Walk Tests (WT), Crowdsourcing (CS), and Subjective Surveys to assess user throughput and Mean Opinion Score (MOS).
TL;DR
To understand why mobile customers are dissatisfied, researchers in Addis Ababa analyzed 3G (UMTS) performance using four different lenses: network systems, expert walk tests, user crowdsourcing, and subjective surveys. The verdict? While the network handles basic browsing, it fails the "HD test," and users' subjective opinions (MOS) directly reflect these technical shortcomings.
Background Positioning
In the rapidly evolving Ethiopian telecommunications landscape, ethio telecom has seen a surge in mobile data subscriptions. However, network expansion doesn't always guarantee user satisfaction. This paper acts as a critical empirical bridge, moving from pure technical KPIs (Key Performance Indicators) to a user-centric QoE (Quality of Experience) model within a specific "Business Area" context.
Problem & Motivation: The Multi-Source Blind Spot
Network operators traditionally live in the world of NMS (Network Management Systems). This provides a "God's eye view" but lacks indoor granularity. Walk Tests (WT) provide that granularity but are expensive and represent a single point in time. Crowdsourcing (CS) offers scale but can be "optimistic" or noisy.
The authors argue that none of these tools alone can tell the full story. By cross-referencing all four, they aim to uncover whether user dissatisfaction is a matter of technical capacity or subjective expectations.
Methodology: The Four-Pillared Framework
The study focused on 20 buildings in the Addis Ababa business district, collecting data during peak office hours (9 am – 4 pm).
The Stack:
- NMS (Nastar): Collected hex-grid geographic throughput data at 50m resolution.
- Walk Test (Nemo Handy): Experts physically moved through floors to simulate professional-grade measurement.
- Crowdsourcing (RTR-NetTest): 31 office workers used their own diverse smartphones (21 different models) to record real-world speeds.
- Subjective Survey: 129 participants provided feedback on a 5-point scale to derive the Mean Opinion Score (MOS).
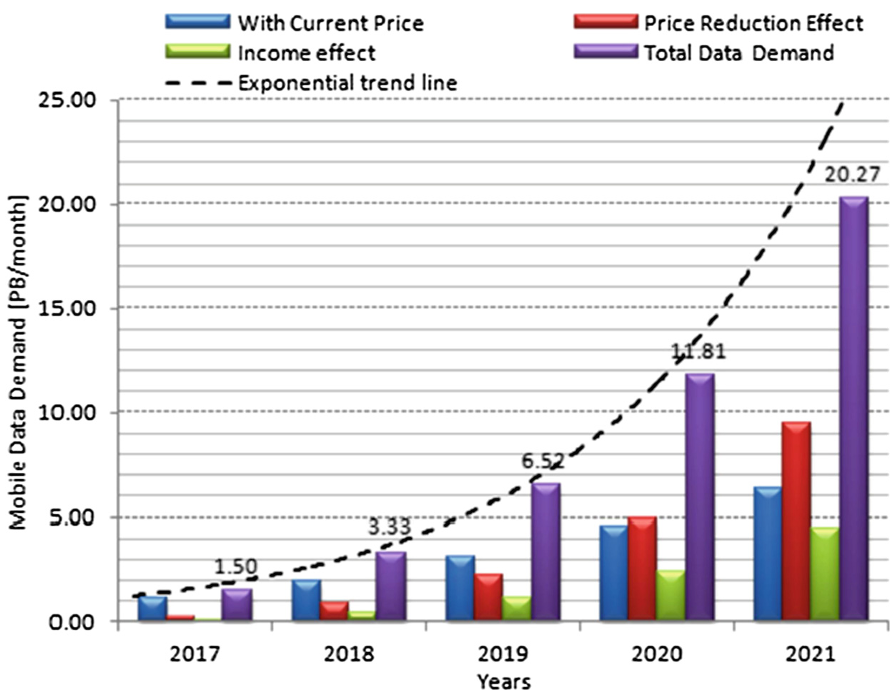 Figure: The demand projection showing the rapid growth of data traffic in Addis Ababa.
Experiments & Results: The "HD" Failure
The core of the analysis compared actual throughput ratios against minimum requirements for various services:
- Low bandwidth: Browsing (0.3 Mbps) and Offline Video (0.5 Mbps).
- High bandwidth: HD Video Calls (1.5 Mbps) and Live HD Streaming (3.2 Mbps).
Key Findings:
- Success in Basics: For web browsing and offline YouTube, the 50th percentile (median) performance from all sources was satisfactory.
- The Streaming Struggle: For Live HD Streaming, almost all measurement methods (NMS and WT) showed the median user falls below the 1.0 ratio (meaning they can't reach the required 3.2 Mbps). Only the "optimistic" 90th percentile of Crowdsourcing participants managed to achieve a smooth HD experience.
- The MOS Consensus: The subjective survey returned a MOS of 2.96 for overall quality. Given that a score of 3.5 is generally considered the threshold for "satisfaction," the data clearly shows that users perceive the network as inadequate.
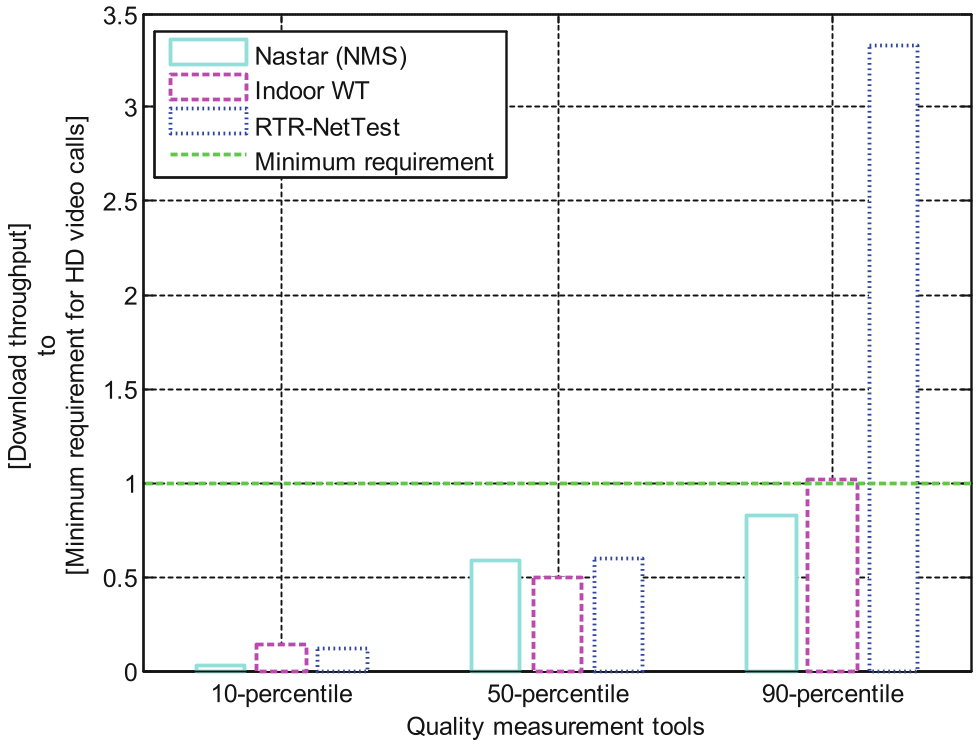 Figure: Throughput results relative to HD Video Call requirements. Most users (10%-ile and 50%-ile) are well below the required threshold.
Critical Analysis & Conclusion
Takeaway
The study proves that QoS and QoE are inextricably linked in the Addis Ababa market. When technical throughput for high-demand apps (Video/Social Media) fails to meet the 1.5-3.2 Mbps threshold, the user satisfaction scores drop predictably.
Comparison of Methods
One fascinating insight is that Crowdsourcing (CS) yielded the most optimistic results. This suggests that CS users might be "self-selecting"—perhaps those with better phones or located in better parts of the office are more likely to run the test, potentially skewing the data if used in isolation.
Limitations & Future Work
- 3G vs. 4G/5G: The study focused on UMTS (3G). As LTE and 5G expand, the "bottleneck" will shift from raw throughput to latency and jitter.
- Device Bias: The list of 21 unique smartphone models shows a wide range of capabilities. Future research should normalize results based on the UE (User Equipment) Category.
In conclusion, for operators like ethio telecom, the path to satisfaction isn't just "more towers," but targeted indoor optimization specifically for the high-bandwidth video services that modern users now consider standard.