
Analyzing MPEG-DASH QoE: Real-World Lessons from Crowdsourcing
Quality of Experience of Web-based Adaptive HTTP Streaming Clients in Real-World Environments using Crowdsourcing
This paper presents a comparative study of the Quality of Experience (QoE) of Web-based MPEG-DASH clients, including YouTube, DASH-JS, and dash.js, in real-world environments. By leveraging a crowdsourcing-based subjective quality assessment, the authors identify the performance disparities between commercial and open-source adaptive streaming implementations.
TL;DR
While high-bandwidth laboratory tests suggest that adaptive streaming is a solved problem, real-world deployment tells a different story. This study uses a global crowdsourcing approach to pit YouTube's proprietary player against open-source rivals DASH-JS and dash.js. The verdict? Stalls and bitrate are the king and queen of Quality of Experience (QoE), while startup delay is surprisingly less influential than previously thought.
Problem & Motivation: The Lab vs. The Wild
In the ivory tower of multimedia research, most DASH (Dynamic Adaptive Streaming over HTTP) adaptation algorithms are tested using "canned" network traces. While this ensures reproducibility, it ignores the chaotic nature of the open Internet—varying browser engines, local ISP throttling, and diverse user hardware.
The authors recognized that the industry’s transition to the Media Source Extensions (MSE) and HTML5 provided a unique opportunity to evaluate these clients in the wild. The goal was to determine if open-source implementations, which form the backbone of many private streaming services, could actually compete with the highly optimized infrastructure of a giant like YouTube.
Methodology: The Global Testbed
The researchers used the Microworker platform to recruit 288 participants across Europe, India, and North America. To ensure data integrity in an uncontrolled environment, they implemented several "cheater-detection" mechanisms:
- Browser Fingerprinting: Ensuring one user doesn't vote multiple times.
- Playback Monitoring: Discarding sessions where the video was paused or skipped.
- Statistical Screening: Using Median Absolute Deviation (MAD) to prune outlier ratings.
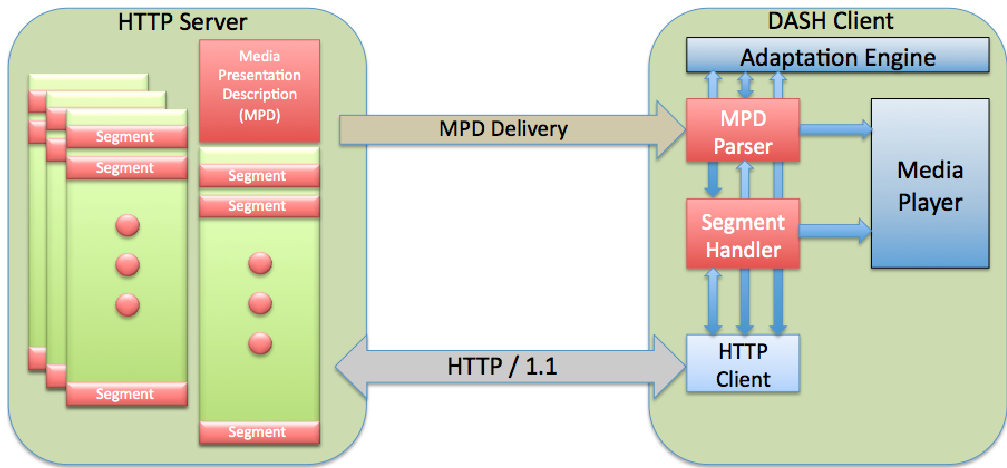 Figure 1: The standard MPEG-DASH architecture. The red components (MPD and segments) are standardized, while the adaptation logic is where clients compete.
Methodology Highlights: The Adaptation Logic
The three clients represent different philosophies:
- YouTube: Highly proprietary, data-driven, and backed by a global CDN.
- DASH-JS: A simple, rate-based heuristic developed for research.
- dash.js: The industry-standard reference client designed for modularity and compliance.
Experiments & Results: What Actually Matters to Users?
The results provided a clear hierarchy of performance. YouTube led the pack, particularly in its ability to maintain high bitrates in the US and Canada. However, the most fascinating insights came from the correlation analysis of QoS (Quality of Service) to QoE (Quality of Experience).
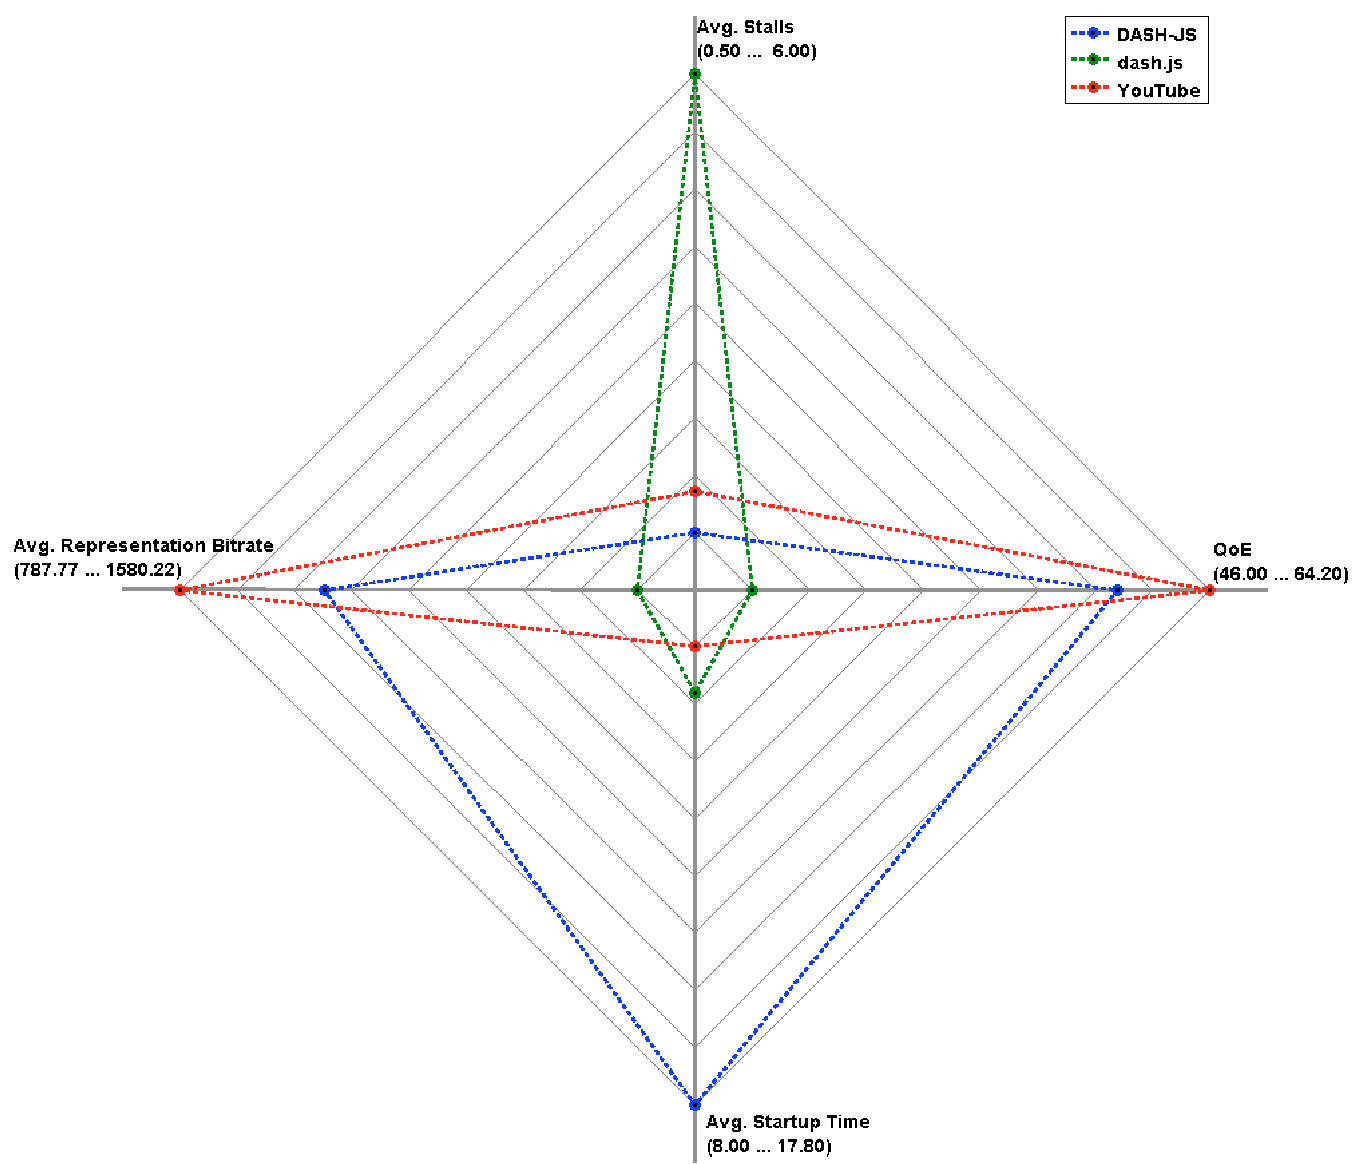 Figure 2: Comparative performance across Bitrate, Startup Time, Stalls, and MOS.
Key Findings:
- The "Wait" Doesn't Hurt (Much): Surprisingly, there was no significant linear correlation between startup time and QoE. Users appear willing to wait a few seconds longer for a video to start if the subsequent playback is smooth and high-quality.
- Stalls are Fatal: Even a single stall event dramatically lowers the Mean Opinion Score (MOS). DASH-JS performed admirably here, maintaining the lowest stall count (0.5 on average) by being conservative with its initial bitrate estimation.
- Bitrate Fluctuations: dash.js was found to be "jittery," switching representations every 4.4 seconds on average. While this suggests high sensitivity to network changes, it resulted in the lowest QoE among the three, likely due to the visual fatigue caused by constant resolution shifts.
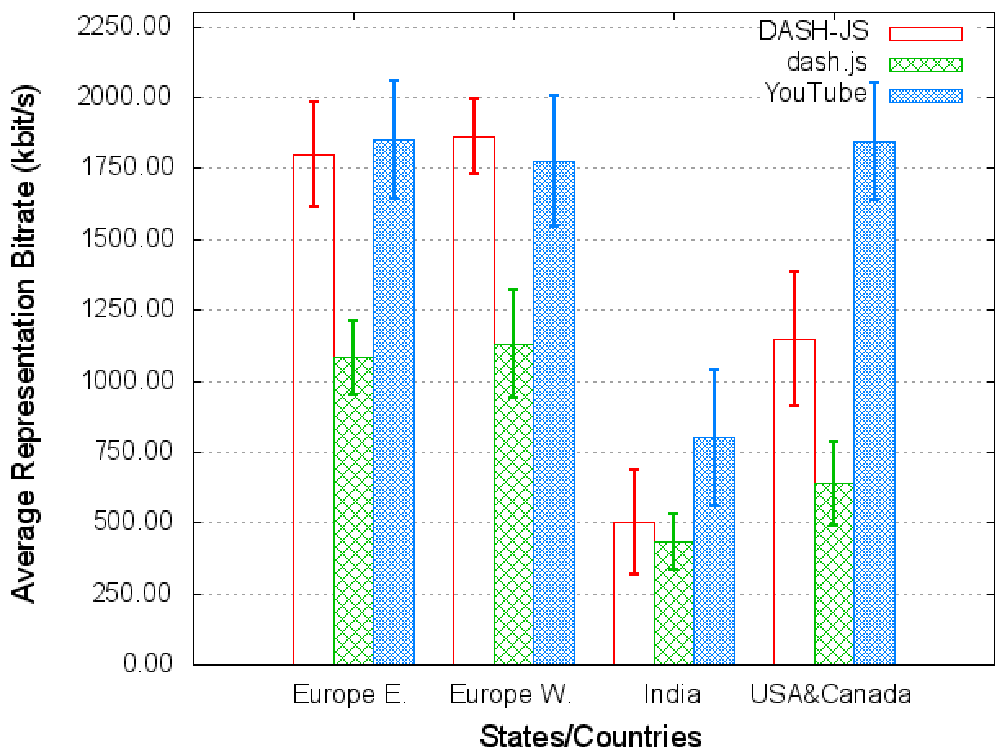 Figure 3: Average representation bitrate by region. Note the significant impact of local infrastructure in India vs. the West.
Critical Analysis & Conclusion
This paper serves as a reality check for multimedia engineers. While we often obsess over reducing "Time to First Frame," the real-world data suggests that stability is paramount.
Takeaway for Developers: If you are building a Web-based player, prioritize a robust buffer over a fast start. A conservative initial bitrate that avoids a mid-stream stall creates a much better user experience than a 4K start followed by a "loading" spinner 10 seconds later.
Limitations: The study focused on a 160-second clip without audio. In long-form content, the cumulative impact of low bitrates might eventually outweigh the negative impact of a single stall. Furthermore, the "Microworker" demographic might be more patient than the average casual viewer, potentially biasing the startup time results.
Future Outlook: As we move toward 8K and Ultra-low latency (LL-DASH), the tradeoff between latency and stability will become even more aggressive. Expanding this crowdsourcing framework to evaluate AI-driven adaptation (like Reinforcement Learning) will be the next frontier in achieving "Netflix-level" quality on open-source stacks.