
Measuring the Invisible: A New Framework to Quantify Regional Circularity
Quantifying the circularity of regional industrial waste across multi-channel enterprises
The paper introduces a novel analytical framework to quantify regional industrial waste circularity by combining Waste Input-Output (WIO) analysis with detailed waste stream mapping. Tested on two UK regions (Durham/Darlington and Newcastle), the method enables benchmarking of circularity at both an aggregate regional level and for specific material types.
TL;DR
To move from a "take-make-dispose" linear economy to a circular one, we must first be able to measure how "circular" we actually are. This paper proposes a rigorous analytical framework using Waste Input-Output (WIO) tables and waste stream mapping to quantify circularity. By testing this in North East England, the authors proved that we can now benchmark regional performance and identify exactly which materials are failing to return to the value chain.
The "Measurement Gap" in Circular Economy
Despite the global buzz around the Circular Economy (CE), we are surprisingly bad at measuring it. Most existing metrics are either too narrow (focusing only on household recycling) or too theoretical. Industrial waste—which constitutes the lion's share of global refuse—is often a "black box." Without a baseline, how can policy makers know if a new regulation actually works? The authors identify this lack of a standardized, granular measurement tool as the primary barrier to sustainable industrial growth.
Methodology: Bridging Money and Materials
The genius of this study lies in its hybrid approach. It doesn't just look at how much waste is produced; it looks at the economic interdependence of industries.
1. The Mathematical Core
Using WIO analysis, the researchers constructed matrices where:
- Row represents the output of a sector.
- Column represents the input received.
- The Waste Matrix () represents the net environmental balance (), where is waste generated and is waste used as input for another process.
2. The Analytical Pipeline
The authors mined data from the ORBIS database (35,116 companies) and the UK Environment Agency to map 2016 waste flows.
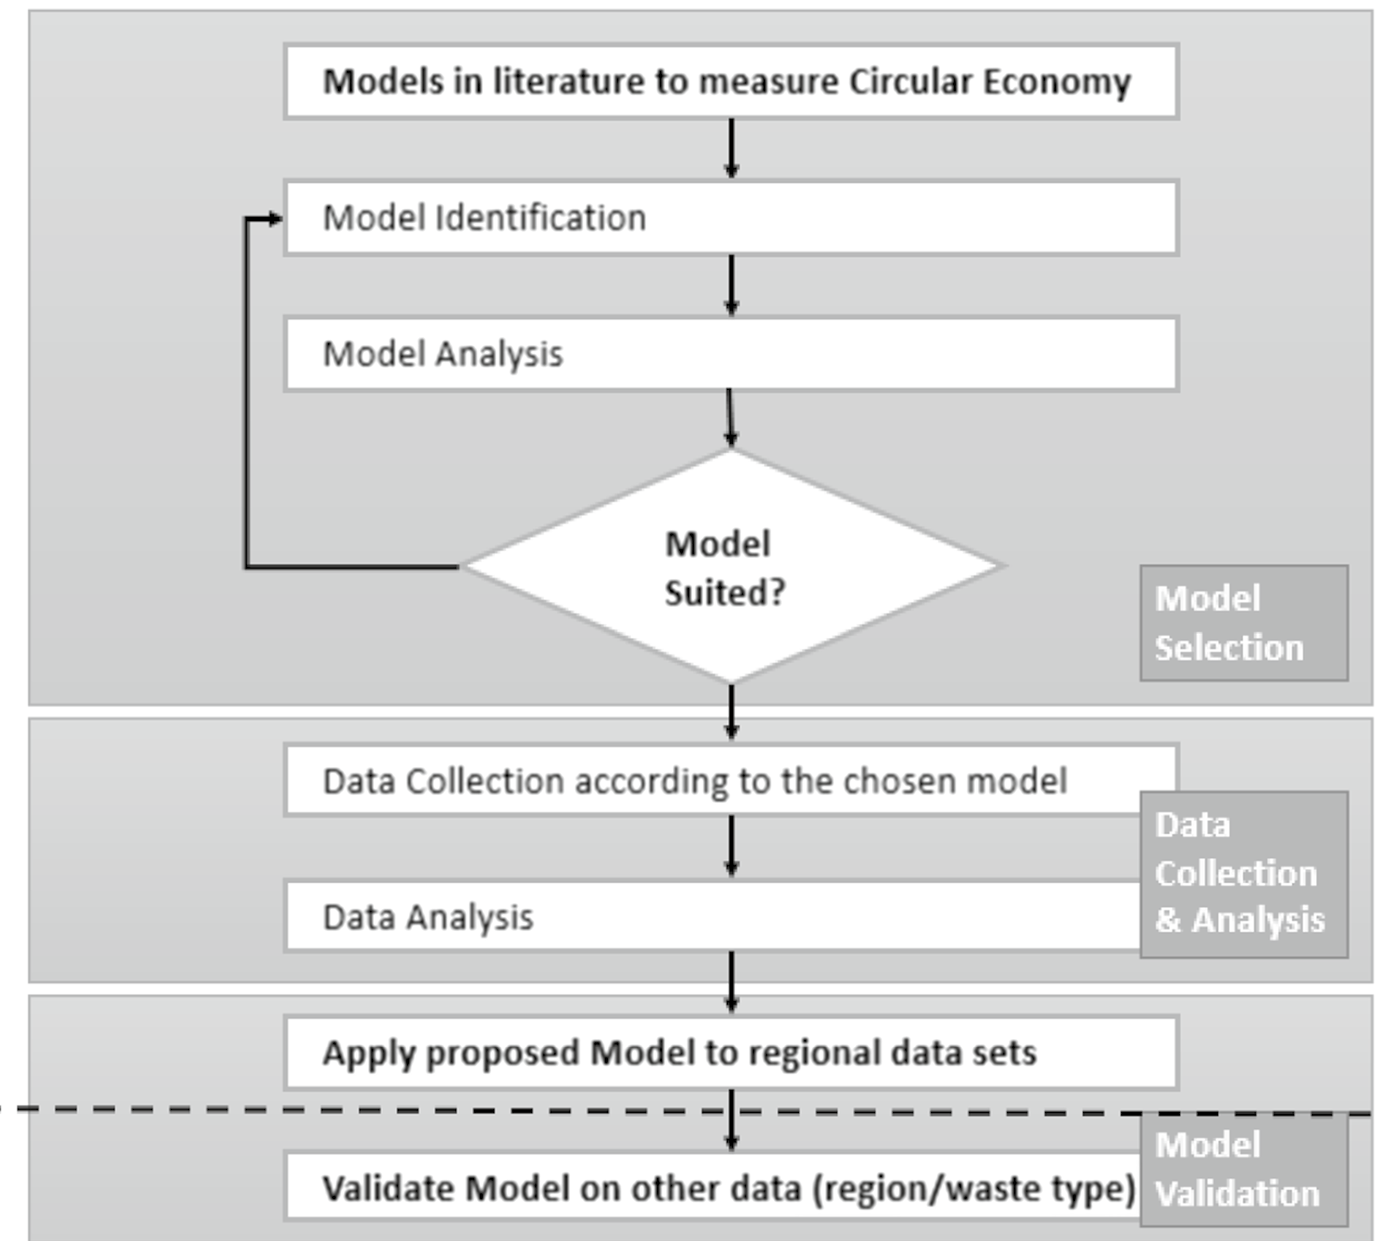 Figure 1: The structured methodology from research question formulation to regional validation.
Battle of the Regions: Durham vs. Newcastle
The framework was applied to two distinct regions to test its benchmarking capabilities. The results were revealing:
- Durham & Darlington: Showed a circularity ratio of 3:1 (3 tonnes in, 1 tonne out as recycled material).
- Newcastle: Achieved a superior 2:1 ratio.
The authors didn't just stop at the "what"; they explored the "why." Durham's lower performance was partly attributed to a much higher percentage of hazardous waste (23% of total vs. 1% in Newcastle), which is inherently harder to recycle.
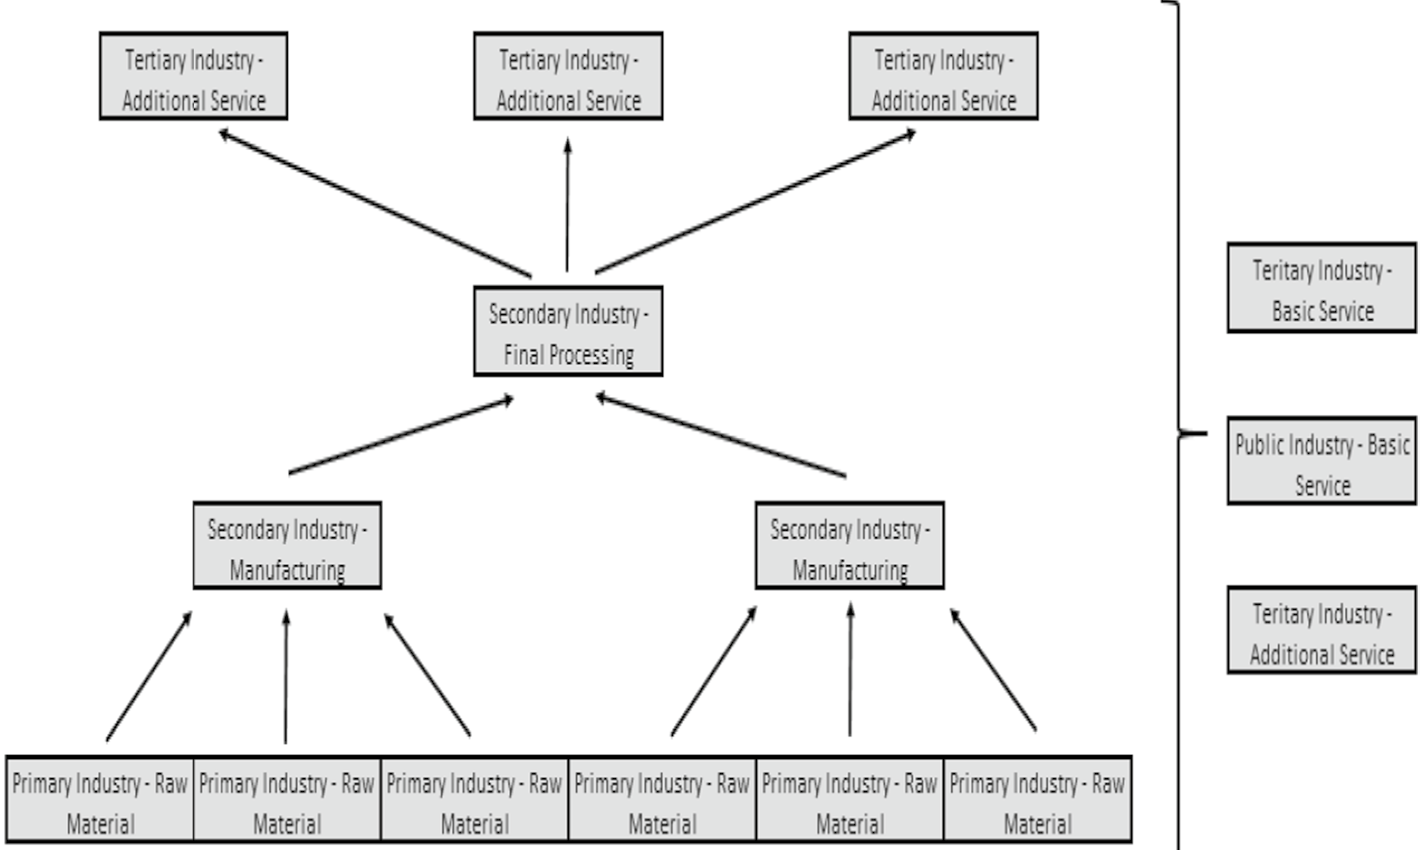 Figure 2: The regional distribution of companies involved in the study, showcasing the industrial diversity.
The "Metal Mystery": Granular Material Insights
One of the most striking findings came from the material-level analysis. For non-ferrous metals in Durham/Darlington, the data showed over 104,000 tonnes entering waste sites, but a tiny fraction leaving. This suggests either a massive bottleneck in processing, long-term storage, or "leakage" where materials are being lost to landfills despite being highly recyclable.
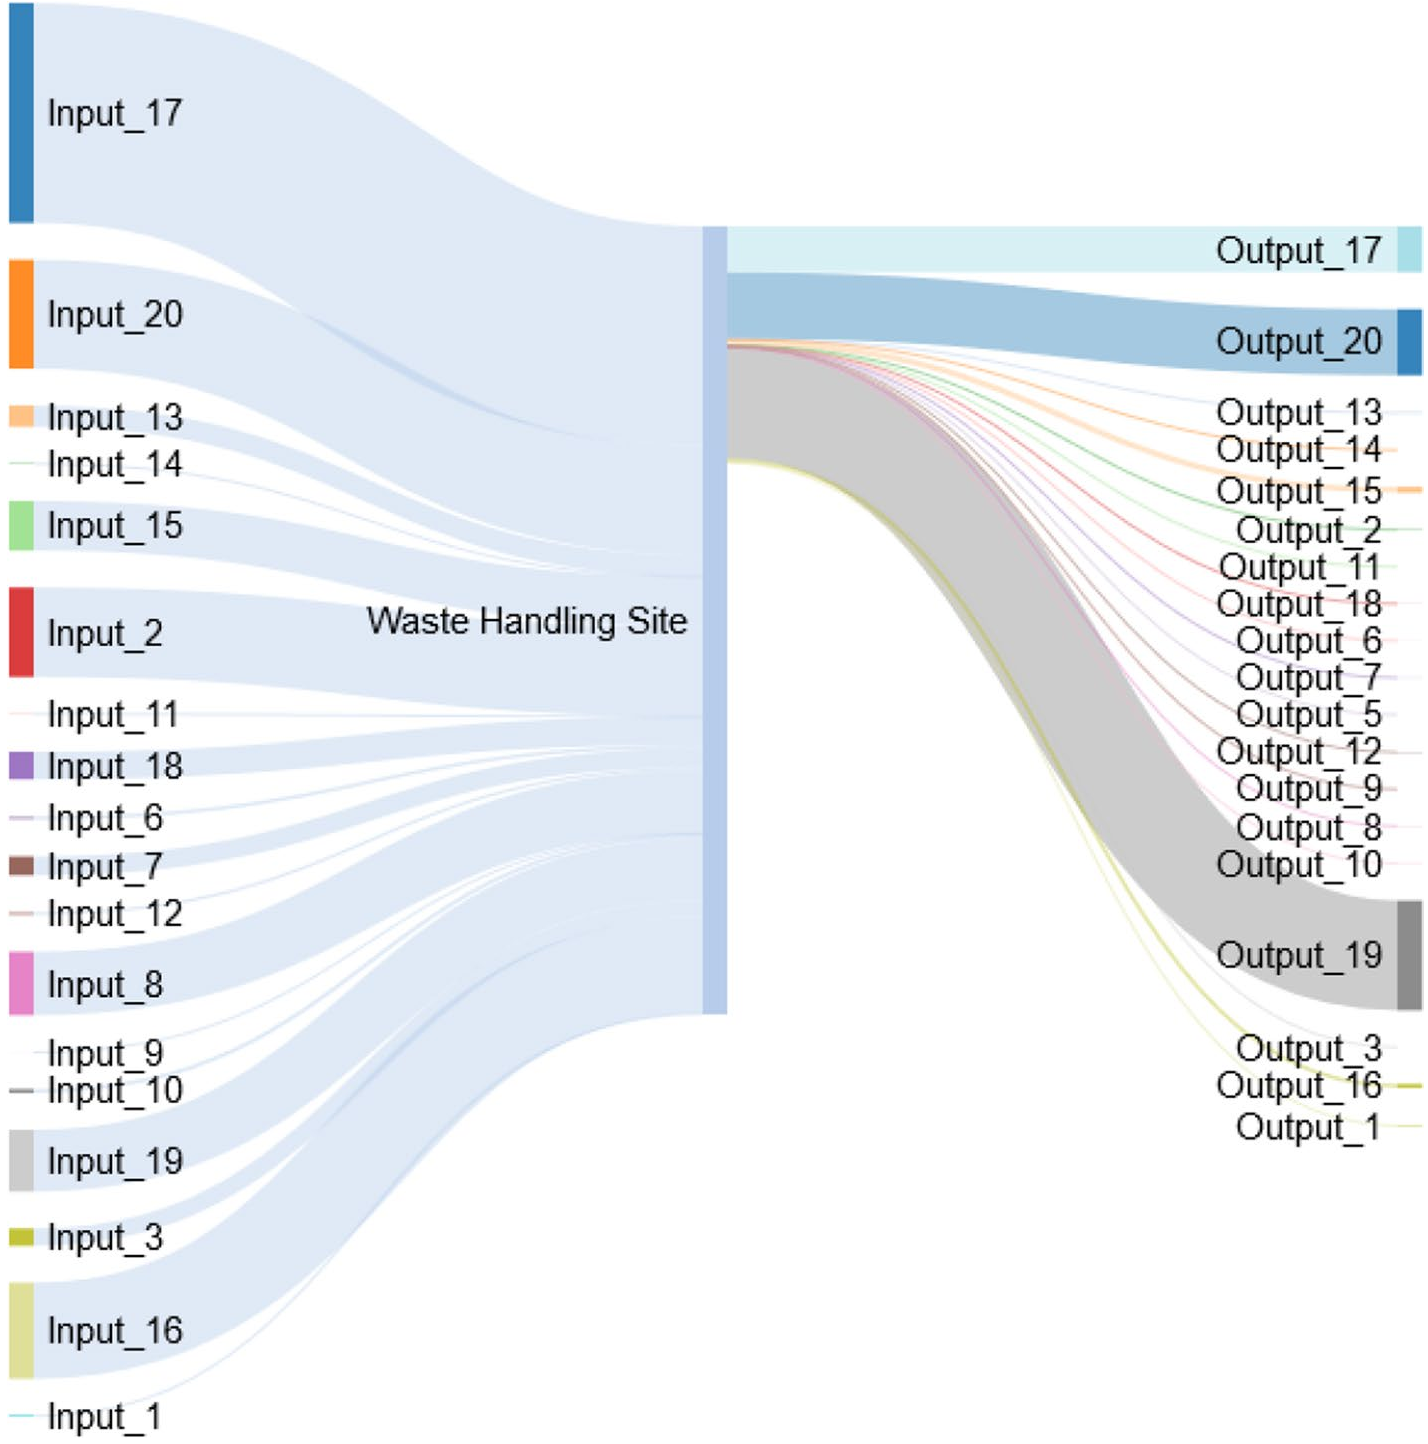 Figure 3: Discrepancy between waste received and removed across various site categories.
Deep Insight & Conclusion
This paper moves the needle from Ecological Philosophy to Industrial Engineering.
Key Takeaways:
- Circularity is Variable: Not all waste is equal. We cannot expect a 1:1 ratio for hazardous materials, but for metals and "inert" waste, the current 3:1 ratio indicates significant room for improvement.
- Data Transparency is Essential: The biggest limitation noted was the "confidentiality" of industrial data. For the Circular Economy to thrive, we need a "legal requirement or voluntary benchmarking" environment where waste data is shared.
- Benchmarking Works: By comparing Newcastle and Durham, the study proves that regional regulations and industrial structures have a measurable impact on sustainability.
Future Outlook: The next step for this technology is integrating Industry 4.0 (IoT sensors and Blockchain) into the WIO framework to provide real-time circularity dashboards for cities and nations.