
Quantifying Social Evolution: Why Time and Decay Matter in Social Networks
Quantifying the Evolutions of Social Interactions
This paper introduces a graph-based model for quantifying the evolution of social interactions using an undirected weighted graph and a temporal decay function. By applying this model to the Digg dataset, it successfully tracks topic popularity and uncovers key dynamic patterns like power-law degree distribution and interaction locality.
TL;DR
Most social network models tell us who is connected, but not how those interactions fade over time. This paper introduces a graph-based model that incorporates a decay function to quantify the evolution of social interactions. It reveals that topic popularity isn't just about total volume—it’s about the "strength" of recent interactions. Key findings include a power-law distribution in interactions and a fascinating "3-hop" locality rule for new connections.
The Motivation: The "Static" Fallacy
In the world of social computing, we often treat a "friendship" or a "reply" as a permanent link. However, human attention is ephemeral. Prior works often focused on connectivity-level evolution (new users joining) while ignoring the interaction-level dynamics.
The authors argue that interactions occurring a long time ago have less influence on a topic's current "viral" status than those happening right now. Without a temporal scale, we cannot distinguish between a dead topic with many historical posts and a rising trend.
Methodology: Interaction Graphs Meet Temporal Decay
The core innovation is the weighting mechanism for the interaction graph. Instead of a simple counter, the weight of an edge between two users is updated in every time slice using a decay function:
This ensures that if two users stop interacting, their connection strength diminishes. The "Global Strength" () of a topic is then calculated as the sum of all node strengths, providing a real-time pulse of the topic’s health.
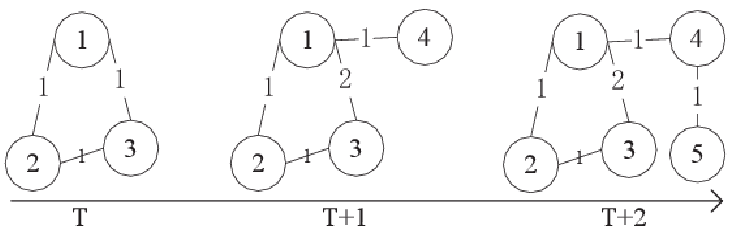 Figure 1: Evolution of social interactions across time slices T to T+2, showing how node weights change dynamically.
Key Insights from the Digg Dataset
1. The Power Law of Interaction
By analyzing the "US Election" topic, the researchers found that interaction degrees follow a power-law distribution. Interestingly, the exponent increases over time (from 0.68 to 0.82), suggesting that as a topic matures, the intensity of interactions concentrates and grows among active participants.
2. The 3-Hop Locality Rule
One of the most surprising findings is the "locality" of interactions. Sociologists often discuss transitivity (friends of friends becoming friends). However, this paper discovers that:
- Users rarely interact with immediate 1-hop or 2-hop neighbors (likely because they already "know" them).
- Maximum new interactions occur at 3 hops.
- Beyond 3-4 hops, the probability of interaction drops significantly.
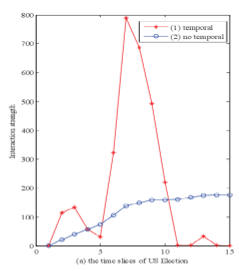 Figure 2: Interaction frequency vs. Hops. Note the peak at 3 hops across different time slices.
3. Tracking Topic "Bursts"
Traditional methods (cumulative frequency) show topic growth as a simple upward curve. The proposed decay-based method, however, captures the burst phase and the subsequent depression phase.
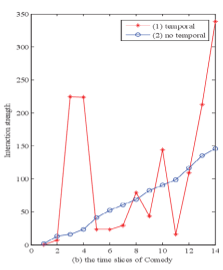 Figure 3: Comparison between the proposed method (Curve 1) and traditional frequency accumulation (Curve 2) for the "US Election". Curve 1 accurately reflects the event's rise and fall.
Critical Analysis & Future Outlook
The strength of this work lies in its simplicity—using a decay function to move from static to dynamic modeling. It effectively shifts the focus from "total reach" to "current engagement."
Limitations: The model uses a fixed decay function. In reality, different topics (e.g., breaking news vs. evergreen entertainment) might decay at different rates. Future research could explore adaptive decay parameters () that adjust based on the topic category.
Conclusion: This research provides a quantitative lens to see social networks not as rigid structures, but as living, breathing systems where the "now" matters much more than the "then." For developers and data scientists building trending algorithms, the takeaway is clear: weight the recent past heavily, and look 3 hops away for the next big connection.