
Beyond the Ballot: Quantifying Political Polarization Through the Lens of Retweets
Quantifying Political Leaning from Tweets, Retweets, and Retweeters
The paper proposes a convex optimization framework to quantify the political leaning of Twitter users using 119 million tweets from the 2012 U.S. election. By integrating tweet-retweet consistency and retweeter similarity (homophily), the method achieves 94% classification accuracy.
TL;DR
This research tackles the challenge of identifying political leaning on Twitter by moving beyond simple text analysis. Using a mathematical framework based on convex optimization, the authors analyze 119 million tweets to map the political spectrum. By assuming that who you retweet—and who retweets you—defines your political identity, the model achieves a remarkable 94% accuracy in positioning users between liberal and conservative poles.
The Core Challenge: Noise, Scale, and Sentiment
Quantifying political orientation is hard. Traditional methods like roll-call analysis (for politicians) or manual coding (for media) don't scale to millions of social media users. Furthermore, text-based sentiment analysis often fails to capture sarcasm or the subtle "approval" signal inherent in a silent retweet.
The authors identify two specific hurdles:
- Quantification: Moving from binary "Left/Right" labels to a continuous numerical score.
- Scalability: Working within the strict rate limits of social media APIs without needing to map the entire global follower graph.
Methodology: The Consistency & Similarity Insight
The paper introduces a two-pronged mathematical intuition:
1. Tweet-Retweet Consistency
People are generally consistent. If a user tweets support for a candidate, they are likely to retweet sources that align with that view. The authors model this as a "linear inverse problem," where the goal is to make the average sentiment of a user’s tweets match the weighted average of the leaning of the sources they retweet.
2. Network Homophily (Similarity)
"Birds of a feather retweet together." If Source A and Source B are retweeted by the same group of people, Sources A and B likely occupy the same political space. This is implemented via Graph Laplacian Regularization, which penalizes large differences in scores between "similar" users.
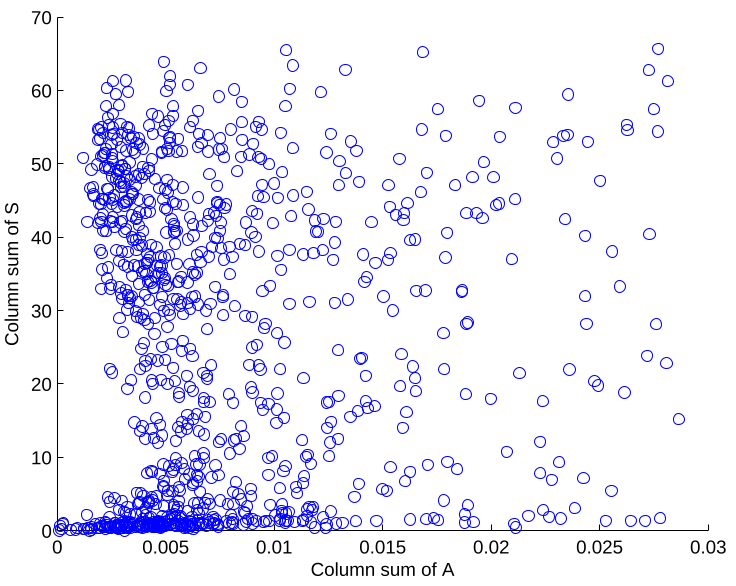 Fig 1: The workflow from raw Twitter data to optimized political leaning scores.
To solve the "vocal minority" issue—where a few loud users drown out the silent majority—the authors use Matrix Scaling. This standardizes the influence of users regardless of their total tweet volume, ensuring numerical stability for less active accounts.
Experimental Results: High Stakes and SOTA Performance
The model was tested against 119 million tweets from the 2012 Obama vs. Romney election. Using manual labels from 12 judges as ground truth, the algorithm outperformed PCA and simple sentiment analysis baselines significantly.
| Algorithm | Accuracy | Kendall's τ (Ranking) |
|---|---|---|
| Ours (Cosine Matrix) | 94% | 0.652 |
| Sentiment Analysis | 78% | 0.511 |
| PCA | 59% | 0.002 |
One of the most striking visualizations is the similarity matrix of candidates. As shown below, there is a stark, dark divide between parties, confirming that the retweeter audience is a powerful discriminator of political identity.
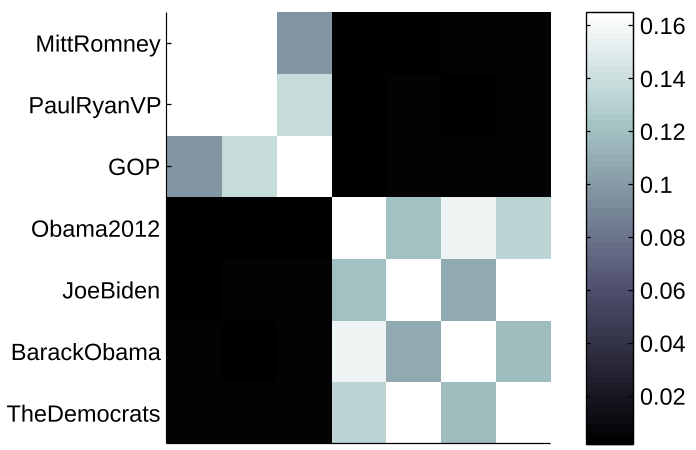 Fig 2: A clear partisan divide in the co-retweeter network.
Deep Insights: The Pulse of the Electorate
The paper goes beyond mathematics to provide sociological observations:
- Polarization vs. Activity: Highly vocal users (the "Twitter Elite") are far more polarized than the average user. Most "ordinary" users are actually more liberal and less extreme.
- The Dynamics of an Event: During major events (like debates), polarization actually drops temporarily. This is because "neutral" or less political users join the conversation, diluting the partisan echo chambers.
- The "Parody" Factor: Parody accounts (humor) tend to lean liberal and are notoriously unstable in their scores, as their viral nature depends more on humor than consistent political ideology.
Conclusion & Limitations
This work demonstrates that political leaning is encoded more in the structure of interaction than in the content of words. By leveraging retweets as a signal of active endorsement, the framework provides a scalable way to monitor the "political health" of a digital population.
Limitations: The study relies on a "bipolar" (Liberal vs. Conservative) assumption, which might not hold in multi-party systems or for non-Western political landscapes. Additionally, the rise of "hate-retweeting" (retweeting to mock) in modern years might require the consistency term to be updated with more nuanced stance detection.
Future Outlook
This methodology paves the way for real-time social media monitoring of economic, diplomatic, or religious shifts. As "Likes" and "Shares" continue to be the currency of the digital age, the ability to mathematically map them to ideological shifts remains a vital tool for computational social science.