
Decoding the Signal in the Noise: A Quantitative Framework for Social Media Confusion
A Quantitative Model and Analysis of Information Confusion in Social Networks
This paper introduces the first quantitative model for "Information Confusion" in social networks, borrowing concepts from wireless communication theory. It proposes the Information-to-Confusion Noise Ratio (ICNR) and utilizes a non-cooperative game theory framework with pricing to determine optimal information transmission intensities.
TL;DR
Researchers have finally quantified the "headache" of social media. By treating contradictory tweets and conflicting posts as electronic "noise" (interference), this paper applies wireless communication power-control math to social networks. It reveals that the key to reducing confusion isn't just "better" information, but how trust is distributed across the network.
The "Restaurant Dilemma": Why Quality Information Fails
Imagine you ask for a restaurant recommendation. Person A says it's delicious; Person B says the service is slow; Person C says Paul eats there thrice a week. Individually, these are valid data points. Collectively, they create Information Confusion.
Previous studies treated this qualitatively—essentially saying, "Yeah, the internet is noisy." This paper argues that if we can't measure the confusion, we can't mitigate it. The authors identify three friction points:
- Source Attributes: How aggressive are the providers?
- Consumer Characteristics: How much "natural dilemma" (internal uncertainty) does the user have?
- Trust Relations: Who do we actually believe?
Methodology: The ICNR Metric
The core innovation is the Information-to-Confusion Noise Ratio (ICNR). If this sounds like the SINR metric on your smartphone, that’s because it is.
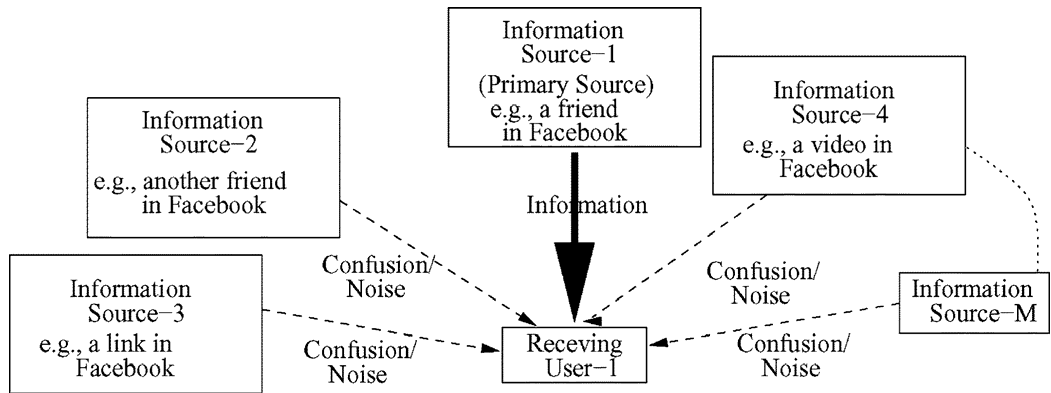 Fig 1: Modeling a social network where 'Information Source' acts as a transmitter and the user as a receiver, with other sources acting as interference.
The formula effectively states:
- Signal: Your primary source’s intensity (credibility + aggression) multiplied by your trust in them.
- Interference (Confusion): The sum of all other sources' intensities, adjusted by how much they contradict the primary source and how much you trust them.
- Noise: Your own inability to process information.
The Game of Aggression vs. Pricing
Why don't information providers (like brands or political influencers) just shout at 100% volume all the time? Pricing.
The authors model this as a non-cooperative game. "Pricing" isn't just money; it's the emotional cost of being seen as "overly aggressive" or the resource cost of citing sources.
- Aggressive Networks: Occur when the "price" of shouting is low. Everyone screams, and ICNR plummets.
- Passive Networks: Occur when the penalty for providing information is too high (fear of criticism), leading to zero useful signal.
Key Insight: The Stability of Trust
Using Twitter data across different geographical regions regarding airport body scans, the study found a startling correlation between Trust and Stability.
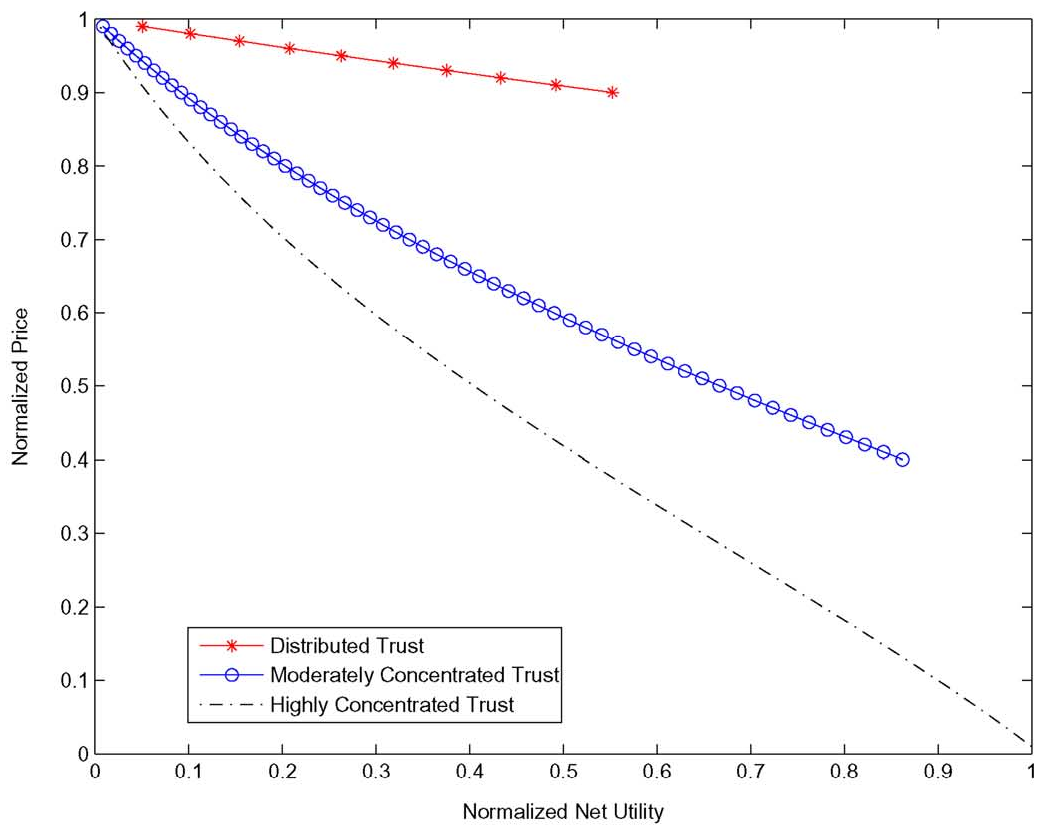 Fig 2: Net utility under different trust scenarios. Distributed trust (believing everyone) leads to rapid drops in utility.
The "Teenager" vs. "Expert" Network
- Distributed Trust: If a consumer trusts every source equally (common in younger or less specialized demographics), the network is unstable. Providers oscillate wildly between being "too aggressive" and "too passive." Confusion is maximized.
- Concentrated Trust: When users have 1-2 "Holy Grail" sources, the network reaches a stable equilibrium. Providers can use moderate intensity, and consumers experience high clarity (High ICNR).
Critical Analysis & Future Outlook
This paper is a masterclass in cross-disciplinary application. By pulling M-matrix theory from linear algebra and power control from electrical engineering, it provides a "physical" law for social interactions.
Limitations: The current model assumes we can easily quantify "contradiction" (the factor). In reality, sarcasm, subtle misinformation, and "fake news" are harder to quantify than the sentiment analysis used in the Twitter dataset.
Takeaway for AI and Content Curators: To fix social media confusion, we don't need more facts. We need to help users build "Concentrated Trust." Algorithms that promote a thousand equally weighted opinions are mathematically destined to maximize confusion.