
Storm-CUSUM: Bridging Distributed Computing and Statistical Control for Real-Time IoT Anomaly Detection
Real-Time Anomaly Detection from Environmental Data Streams
This paper presents a generic, real-time anomaly detection system for environmental sensor networks. It integrates the statistical CUmulative SUM (CUSUM) algorithm with the Apache Storm distributed processing framework to handle massive data streams and generate low-latency notifications.
TL;DR
This research introduces a scalable infrastructure for detecting abrupt changes in environmental sensor data as they happen. By embedding the CUSUM (Cumulative Sum) statistical algorithm into the Apache Storm framework, the authors provide a "Big Data" solution that monitors air quality pollutants in real-time, moving beyond traditional batch-oriented analysis.
Problem: The "Big Data" Latency Gap in Environmental Monitoring
As the Internet of Things (IoT) expands, environmental sensors generate a continuous "pulse" of data points. However, translating these raw measurements into actionable insights—such as hazardous air quality alerts—often suffers from two major bottlenecks:
- Processing Latency: Most systems use Hadoop-style batch processing, which is "too late" for incidents requiring immediate intervention.
- Order Sensitivity: Anomaly detection algorithms like CUSUM are order-dependent; if data arrives out of sequence or is processed twice, the statistical cumulative sum becomes invalid.
Methodology: High-Speed Statistical Topologies
The authors solve these issues by marrying robust messaging with distributed stream processing.
1. The Real-Time Message Service (RMS)
To ensure data is never lost between the sensor and the processing engine, the system utilizes ActiveMQ (based on JMS). It supports a "Long-Polling" and "Point-to-Point" model, ensuring that every observation is queued and delivered to the processing framework reliably.
2. Storm and Trident: The Engine of Inference
The core of the system is a Storm Topology. While standard Storm doesn't guarantee the order of tuples, the authors use Trident, a high-level abstraction that provides exactly-once semantics and maintains the temporal sequence required by CUSUM.
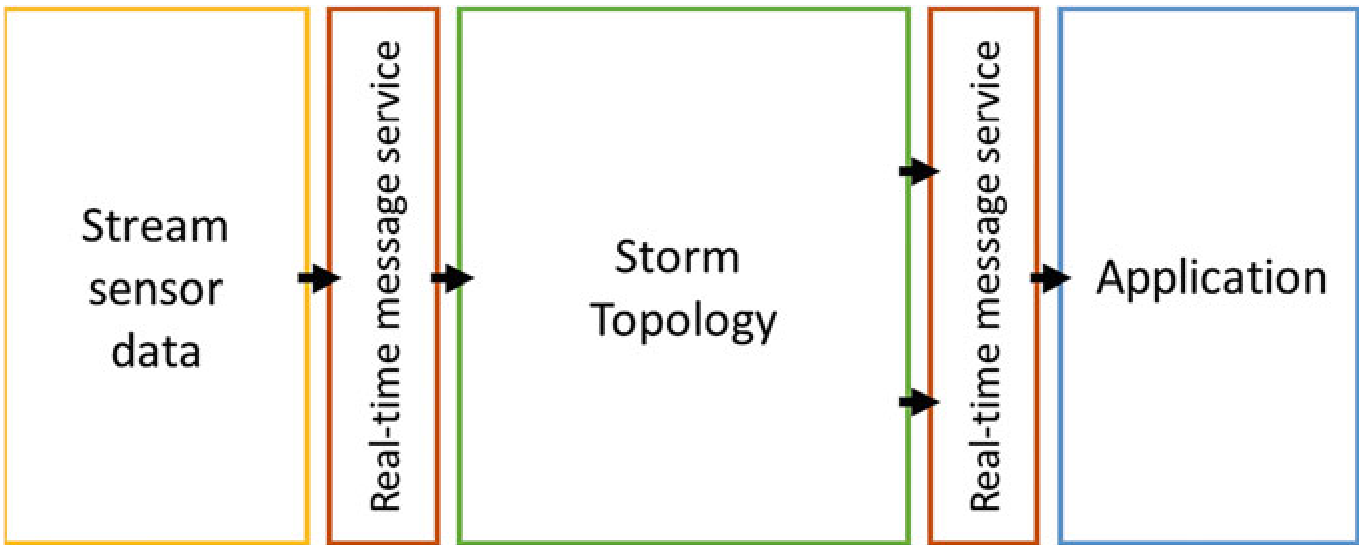 Figure: The system workflow from sensor data streams to the Real-Time Message Service (RMS) and into the Storm Topology.
3. The CUSUM Algorithm
The system implements CUSUM through the following logic:
- It calculates a cumulative sum () based on the deviation from the mean.
- It tracks two variables: (for detecting increases/up-events) and (for detecting decreases/down-events).
- When a value exceeds a calculated threshold (usually ), an alert is triggered.
Experiments & Results: Air Quality in Valencia
To prove the concept, the authors deployed the system on the Valencian Community air quality network, consisting of 61 stations.
Key Findings:
- Versatility: The system successfully handled diverse pollutants, including nitrogen oxides (), carbon monoxide (), and particulate matter ().
- Visualization: An event dashboard was created where sensors change color to red immediately upon an anomaly detection, allowing for real-time spatial analysis.
- Performance: While the test data had hourly refresh rates, the Storm-based architecture is inherently scalable to much higher frequencies (e.g., sub-second readings) by increasing the "parallelization factor" of the Bolts.
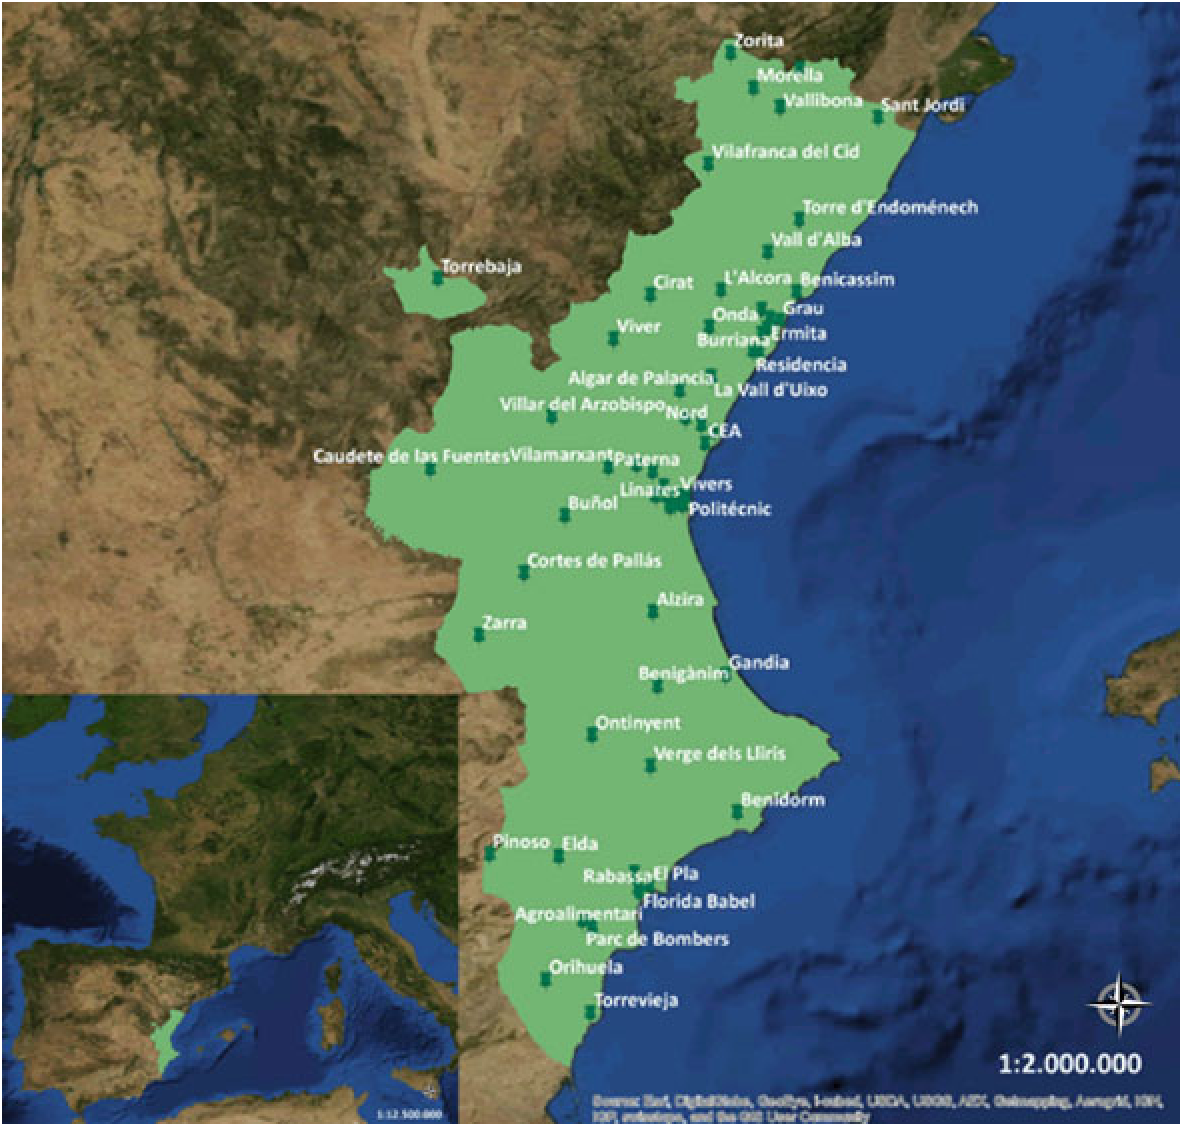 Figure: The Proof-of-Concept Dashboard showing sensor clusters and real-time event markers.
Critical Insight & Conclusion
The true value of this work lies in its architectural modularity. By separating the "Spout" (data ingestion) from the "Bolt" (analysis logic), any statistical algorithm can be swapped in place of CUSUM.
Limitations:
- Normality Assumption: CUSUM assumes data follows a normal distribution. In reality, pollutants often show seasonality or trends that might lead to "false positives" if the threshold isn't dynamically adjusted.
- Standardization: The authors admit the current implementation uses proprietary JSON formats, though they plan to migrate to the OGC Observations and Measurements (O&M) standard for better interoperability.
Future Outlook: The integration of State Management within stream processing (like that found in Flink or Spark Streaming) could further enhance this work, allowing the system to remember long-term trends across months of environmental data while still providing millisecond-level detection.