
MIA: Boosting Cancer Prediction by Uncovering the Statistical Influence of Genes on SVM Margins
Recipe for uncovering predictive genes using support vector machines based on model population analysis
The paper introduces Margin Influence Analysis (MIA), a novel gene selection method for cancer classification that combines Support Vector Machines (SVM) with Model Population Analysis (MPA). By statistically analyzing the margin distributions of thousands of submodels, it identifies a parsimonious set of informative genes, achieving state-of-the-art classification accuracy (0% error on specific subsets) on benchmark microarray datasets.
TL;DR
Gene selection is the "needle in a haystack" problem of bioinformatics. This paper introduces Margin Influence Analysis (MIA), a framework that moves away from ranking genes based on a single model. Instead, it uses a "population" of 10,000 models to statistically prove which genes actually help a Support Vector Machine (SVM) generalize better. By focusing on the SVM margin as a health metric, MIA achieves near-perfect classification accuracy on complex cancer datasets.
Background: The Stability Crisis in Gene Selection
In microarray analysis, we typically deal with thousands of genes () but only dozens of patients (). Standard techniques like Recursive Feature Elimination (RFE) or LASSO are sensitive: remove 10% of your patients, and your "top genes" list might completely change. This instability is a nightmare for clinical validation.
The authors argue that a gene's value shouldn't be judged by its weight in one model, but by its consistent influence on the classifier's margin. A larger margin directly correlates with better generalization (VC theory). If adding a gene consistently "pushes" the classes further apart across thousands of random sub-samplings, that gene is a true biomarker.
Methodology: The Power of the Population
MIA is built on the Model Population Analysis (MPA) framework. The process is elegant:
- Monte Carlo Variable Sampling: Randomly pick a subset of genes and build an SVM. Do this 10,000 times.
- Margin Distribution Split: For every gene , split the 10,000 models into two groups: those that included gene (Group A) and those that didn't (Group B).
- The Significance Test: Instead of a T-test (which assumes normal distribution), use the Mann-Whitney U test to see if Group A has a statistically larger margin than Group B.
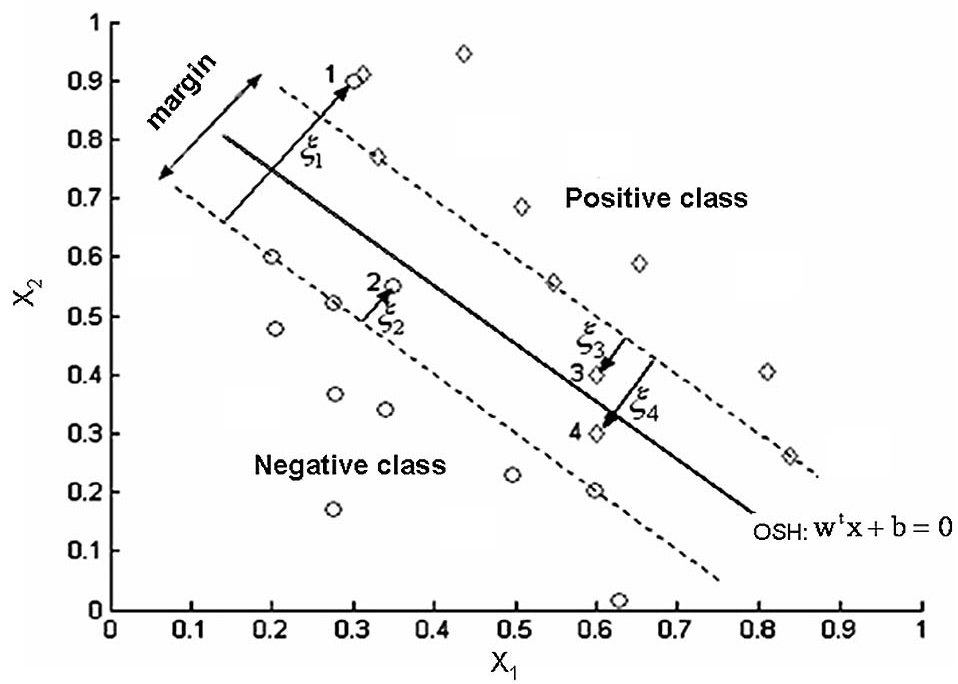 Figure 1: The SVM margin is the distance between the dashed lines. MIA seeks variables that maximize this specific distance.
This approach treats gene selection as a hypothesis testing problem. If a gene has a -value < 0.05, it is labeled "informative."
Experimental Results: Precision at Scale
The authors tested MIA on the Colon and Estrogen datasets. The results were striking:
- Colon Data: MIA identified 108 significant genes. When using 100 genes, the Leave-One-Out Cross-Validation (LOOCV) error dropped to 0%, outperforming LogitBoost (14.5%) and PLS (6.4%).
- Estrogen Data: The error rate similarly stabilized at nearly 0% after selecting 500 genes.
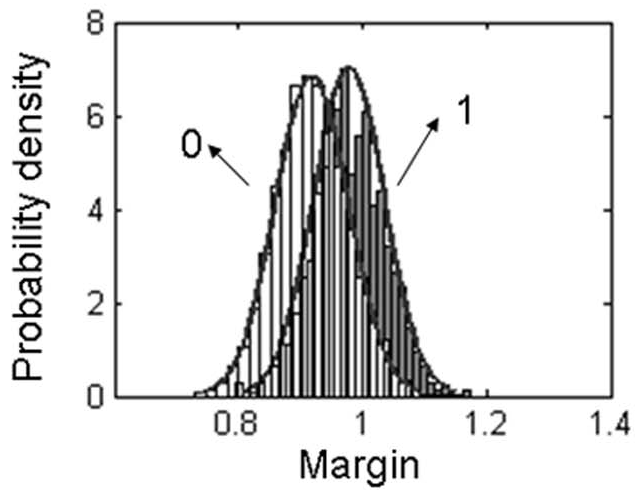 Figure 2: Distribution shifts. Plot A shows an informative gene (Group A is shifted right, increasing the margin), while Plot B shows an uninformative gene that decreases the margin.
Why It Works: The Intuition
By using 10,000 submodels, MIA effectively averages out the "noise" or "luck" associated with any single sample set. It exploits the structural risk minimization principle of SVMs. Most methods focus on reducing training error; MIA focuses on increasing the stability of the margin, which is why it excels in "large , small " scenarios where noise is rampant.
Critical Insight & Limitations
Value: MIA is highly interpretable. It doesn't just give you a number; it gives you a -value, allowing researchers to apply standard multiple-testing corrections (like Holm-Bonferroni) to control false discovery rates in a way that RFE cannot.
Limitations: The main bottleneck is computational cost. Training 10,000 SVM models is significantly more expensive than a single RFE run. However, given that these models are independent, MIA is embarrassingly parallelizable.
Conclusion
MIA represents a shift from "heuristic" feature selection to "statistical" feature selection. By treating model parameters as a population to be analyzed, it provides a robust recipe for uncovering the genetic drivers of cancer. It is a must-read for researchers looking to bridge the gap between machine learning performance and clinical reliability.