
Decoding the Student Life: How Wearables and Phones Predict Success and Stress
Recognizing academic performance, sleep quality, stress level, and mental health using personality traits, wearable sensors and mobile phones
This study leverages multi-modal data from wearable sensors and mobile phones to classify undergraduate students' academic performance, sleep quality, stress, and mental health. By collecting 1,980 days of objective and subjective data from 66 participants, the authors developed a machine learning framework achieving classification accuracies between 67% and 92%.
TL;DR
Researchers from MIT and Harvard have successfully predicted student GPAs, sleep quality, and mental health levels using nothing more than a month's worth of wearable sensor data and smartphone logs. By analyzing patterns like 3 AM screen usage, skin conductance storms during sleep, and social interaction entropy, their machine learning models achieved classification accuracies as high as 92%, proving that our devices know more about our well-being than we might realize.
Background: Beyond the Survey
In the academic world, "how are you doing?" is usually answered by a GPA or a self-reported survey. However, these are lagging indicators. By the time a student reports high stress or receives a low grade, the damage is often done. This study shifts the paradigm from subjective retrospection to objective, continuous monitoring. By identifying the "internal" (Personality) and "external" (Behavioral) factors, the researchers aimed to build a predictive map of student life.
The Multi-Modal Architecture
To capture the full spectrum of human behavior, the study deployed a rigorous 30-day data collection protocol involving 66 students. The data sources were categorized into:
- Physiological (Wearables): Skin Conductance (SC/EDA) for sympathetic nervous system arousal, 3-axis acceleration (ACC) for activity/sleep, and Skin Temperature (ST).
- Social/Behavioral (Mobile Phones): Call/SMS logs, "Screen on" timing, Internet usage, and Mobility (GPS).
- Psychological (Surveys): Big Five Personality traits and standardized health indices (PSQI, PSS, SF-12).
Methodology: Feature Selection and Classification
Because the researchers extracted over 700 features, they used Sequential Forward Feature Selection to avoid the "curse of dimensionality." The goal was to find the 1-3 most "informative" features for each outcome (e.g., GPA or Stress) using Support Vector Machines (SVM).
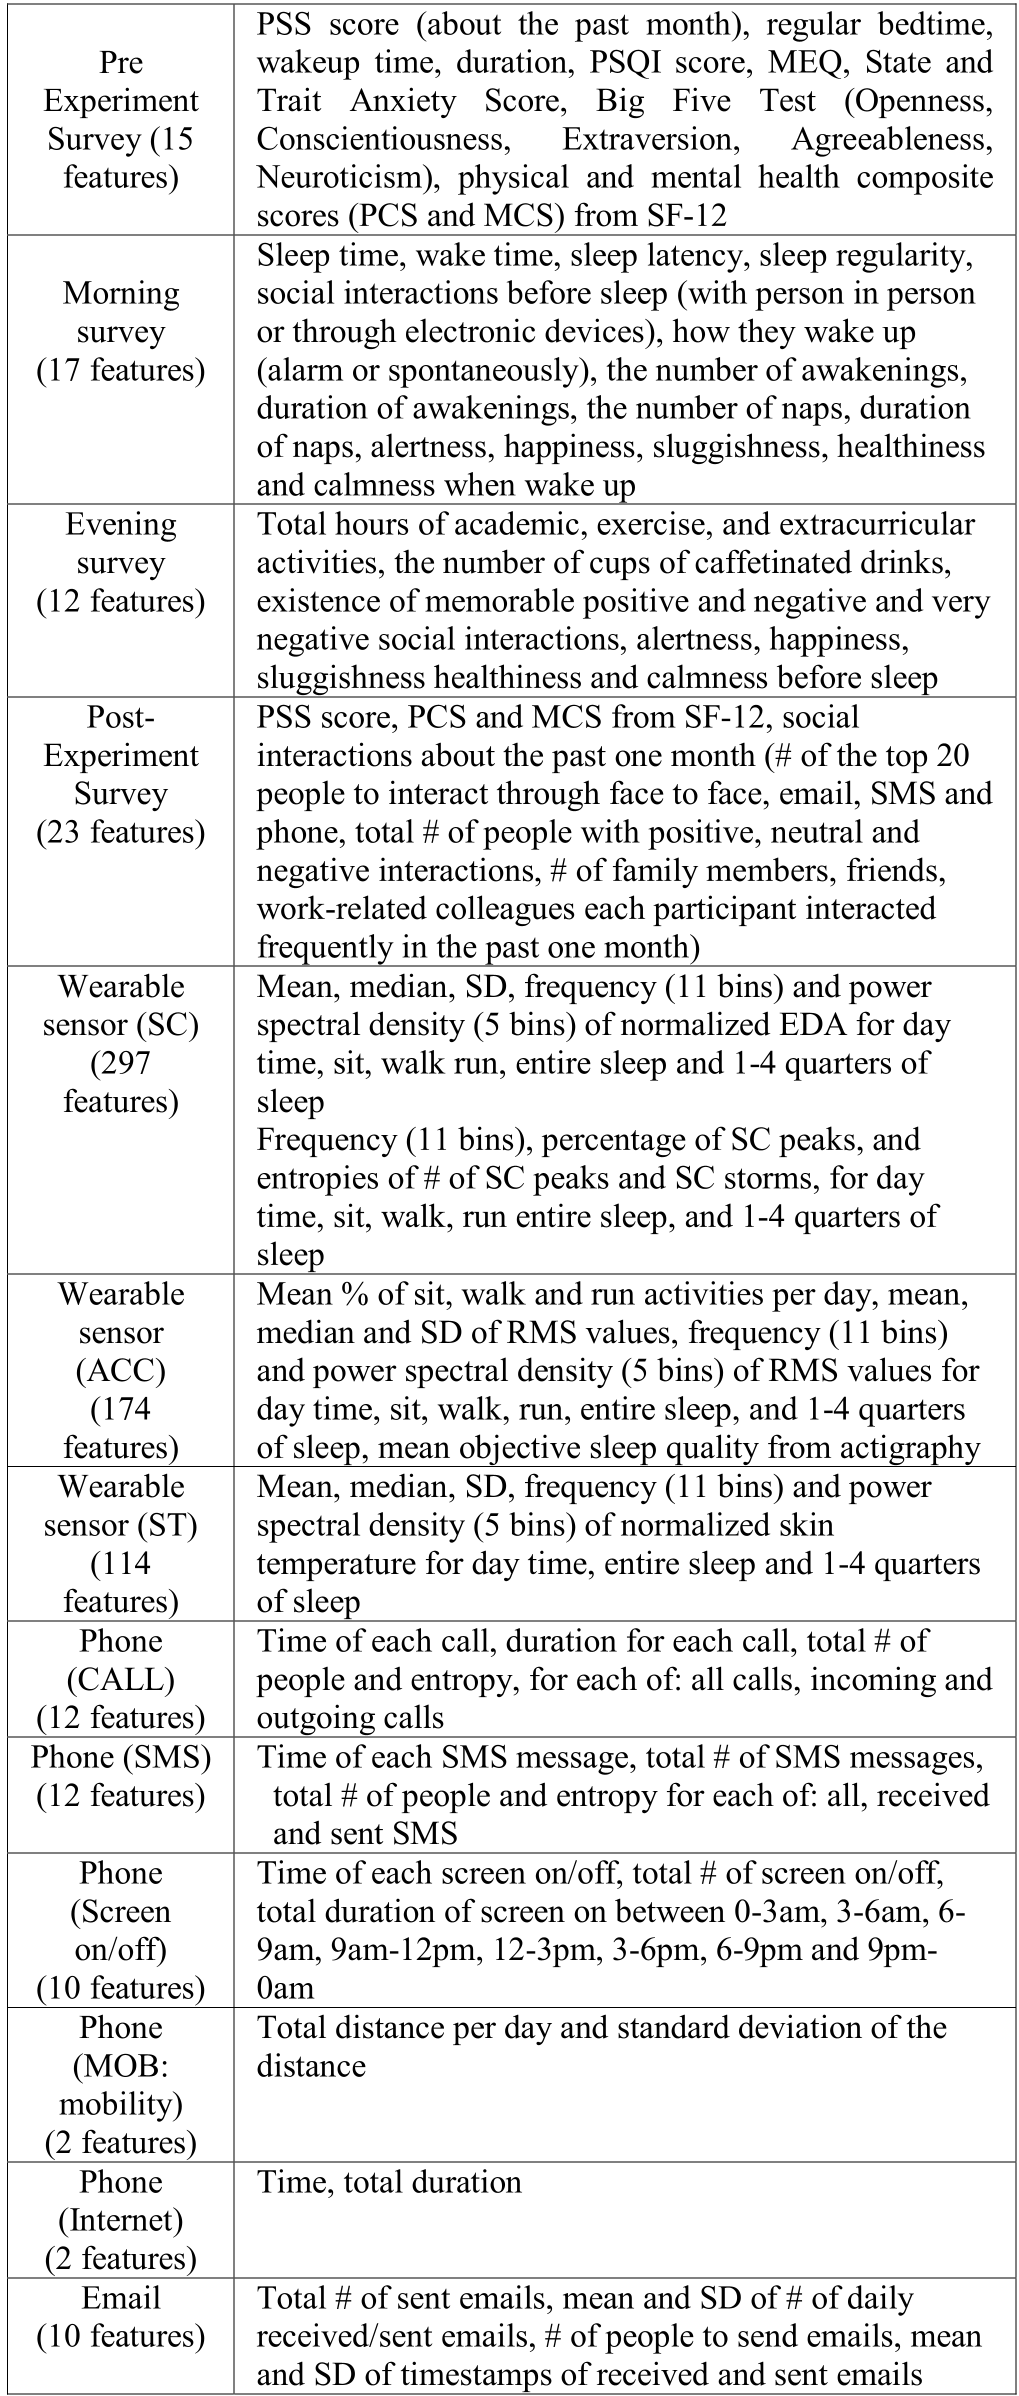 Table 1: The comprehensive list of 700+ features extracted from surveys, wearables, and phones.
Key Insights: What the Data Revealed
The results provide a fascinating "digital fingerprint" of the successful, well-rested, or stressed student:
1. The Anatomy of a High GPA
Interestingly, high academic performance wasn't just about "long hours of study."
- Phone Habits: High GPA students tended to have earlier mean call timestamps and lower call entropy, suggesting a more structured or predictable social life.
- The "Negative" Interaction Paradox: Higher GPA correlated with a higher number of "negative" email contacts—potentially indicating high-stakes environments or complex problem-solving interactions.
2. The Midnight Screen Trap
Poor sleepers (high PSQI scores) were accurately identified by their phone behavior between 3 AM and 6 AM. Longer "screen on" duration during these hours was a primary predictor of poor sleep quality and low sleep regularity.
3. Stress and Personality
Personality alone (specifically Neuroticism) was over 80% accurate in predicting high stress and poor mental health (MCS). However, objective sensor data like Skin Conductance peaks during sit/rest periods added a layer of physiological evidence that surveys couldn't capture.
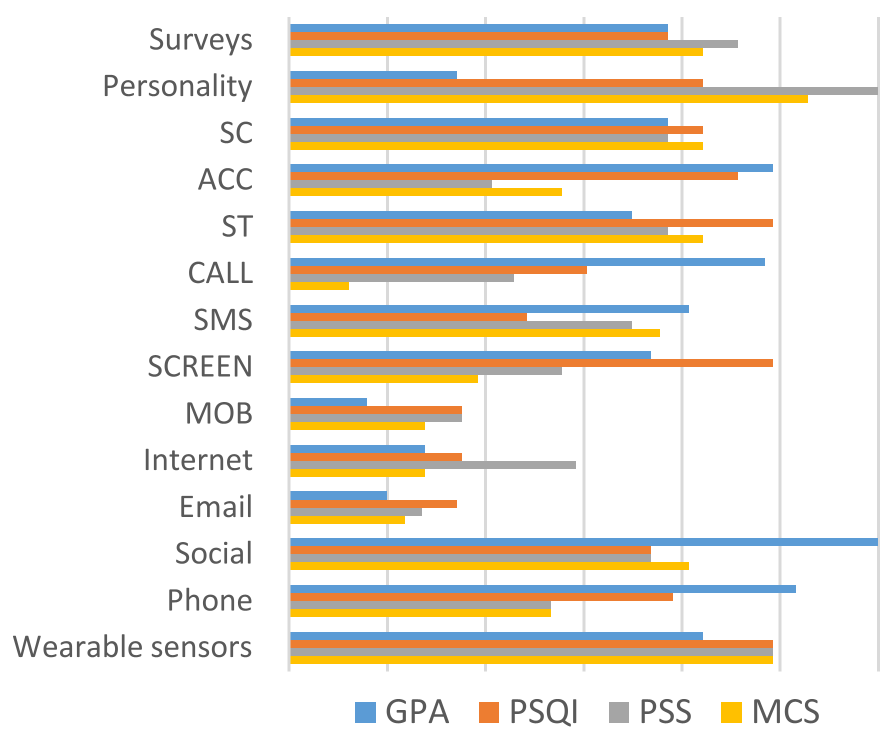 Fig 2: Comparison of classification accuracies across different modalities. Note the high performance of Personality and Wearable features.
Detailed Experimental Results
The table below highlights which features were the "best" predictors for each category. For instance, Happiness (Morning) was a top predictor for global perceived stress, while Skin Conductance frequency during the second quarter of sleep was a key marker for GPA.
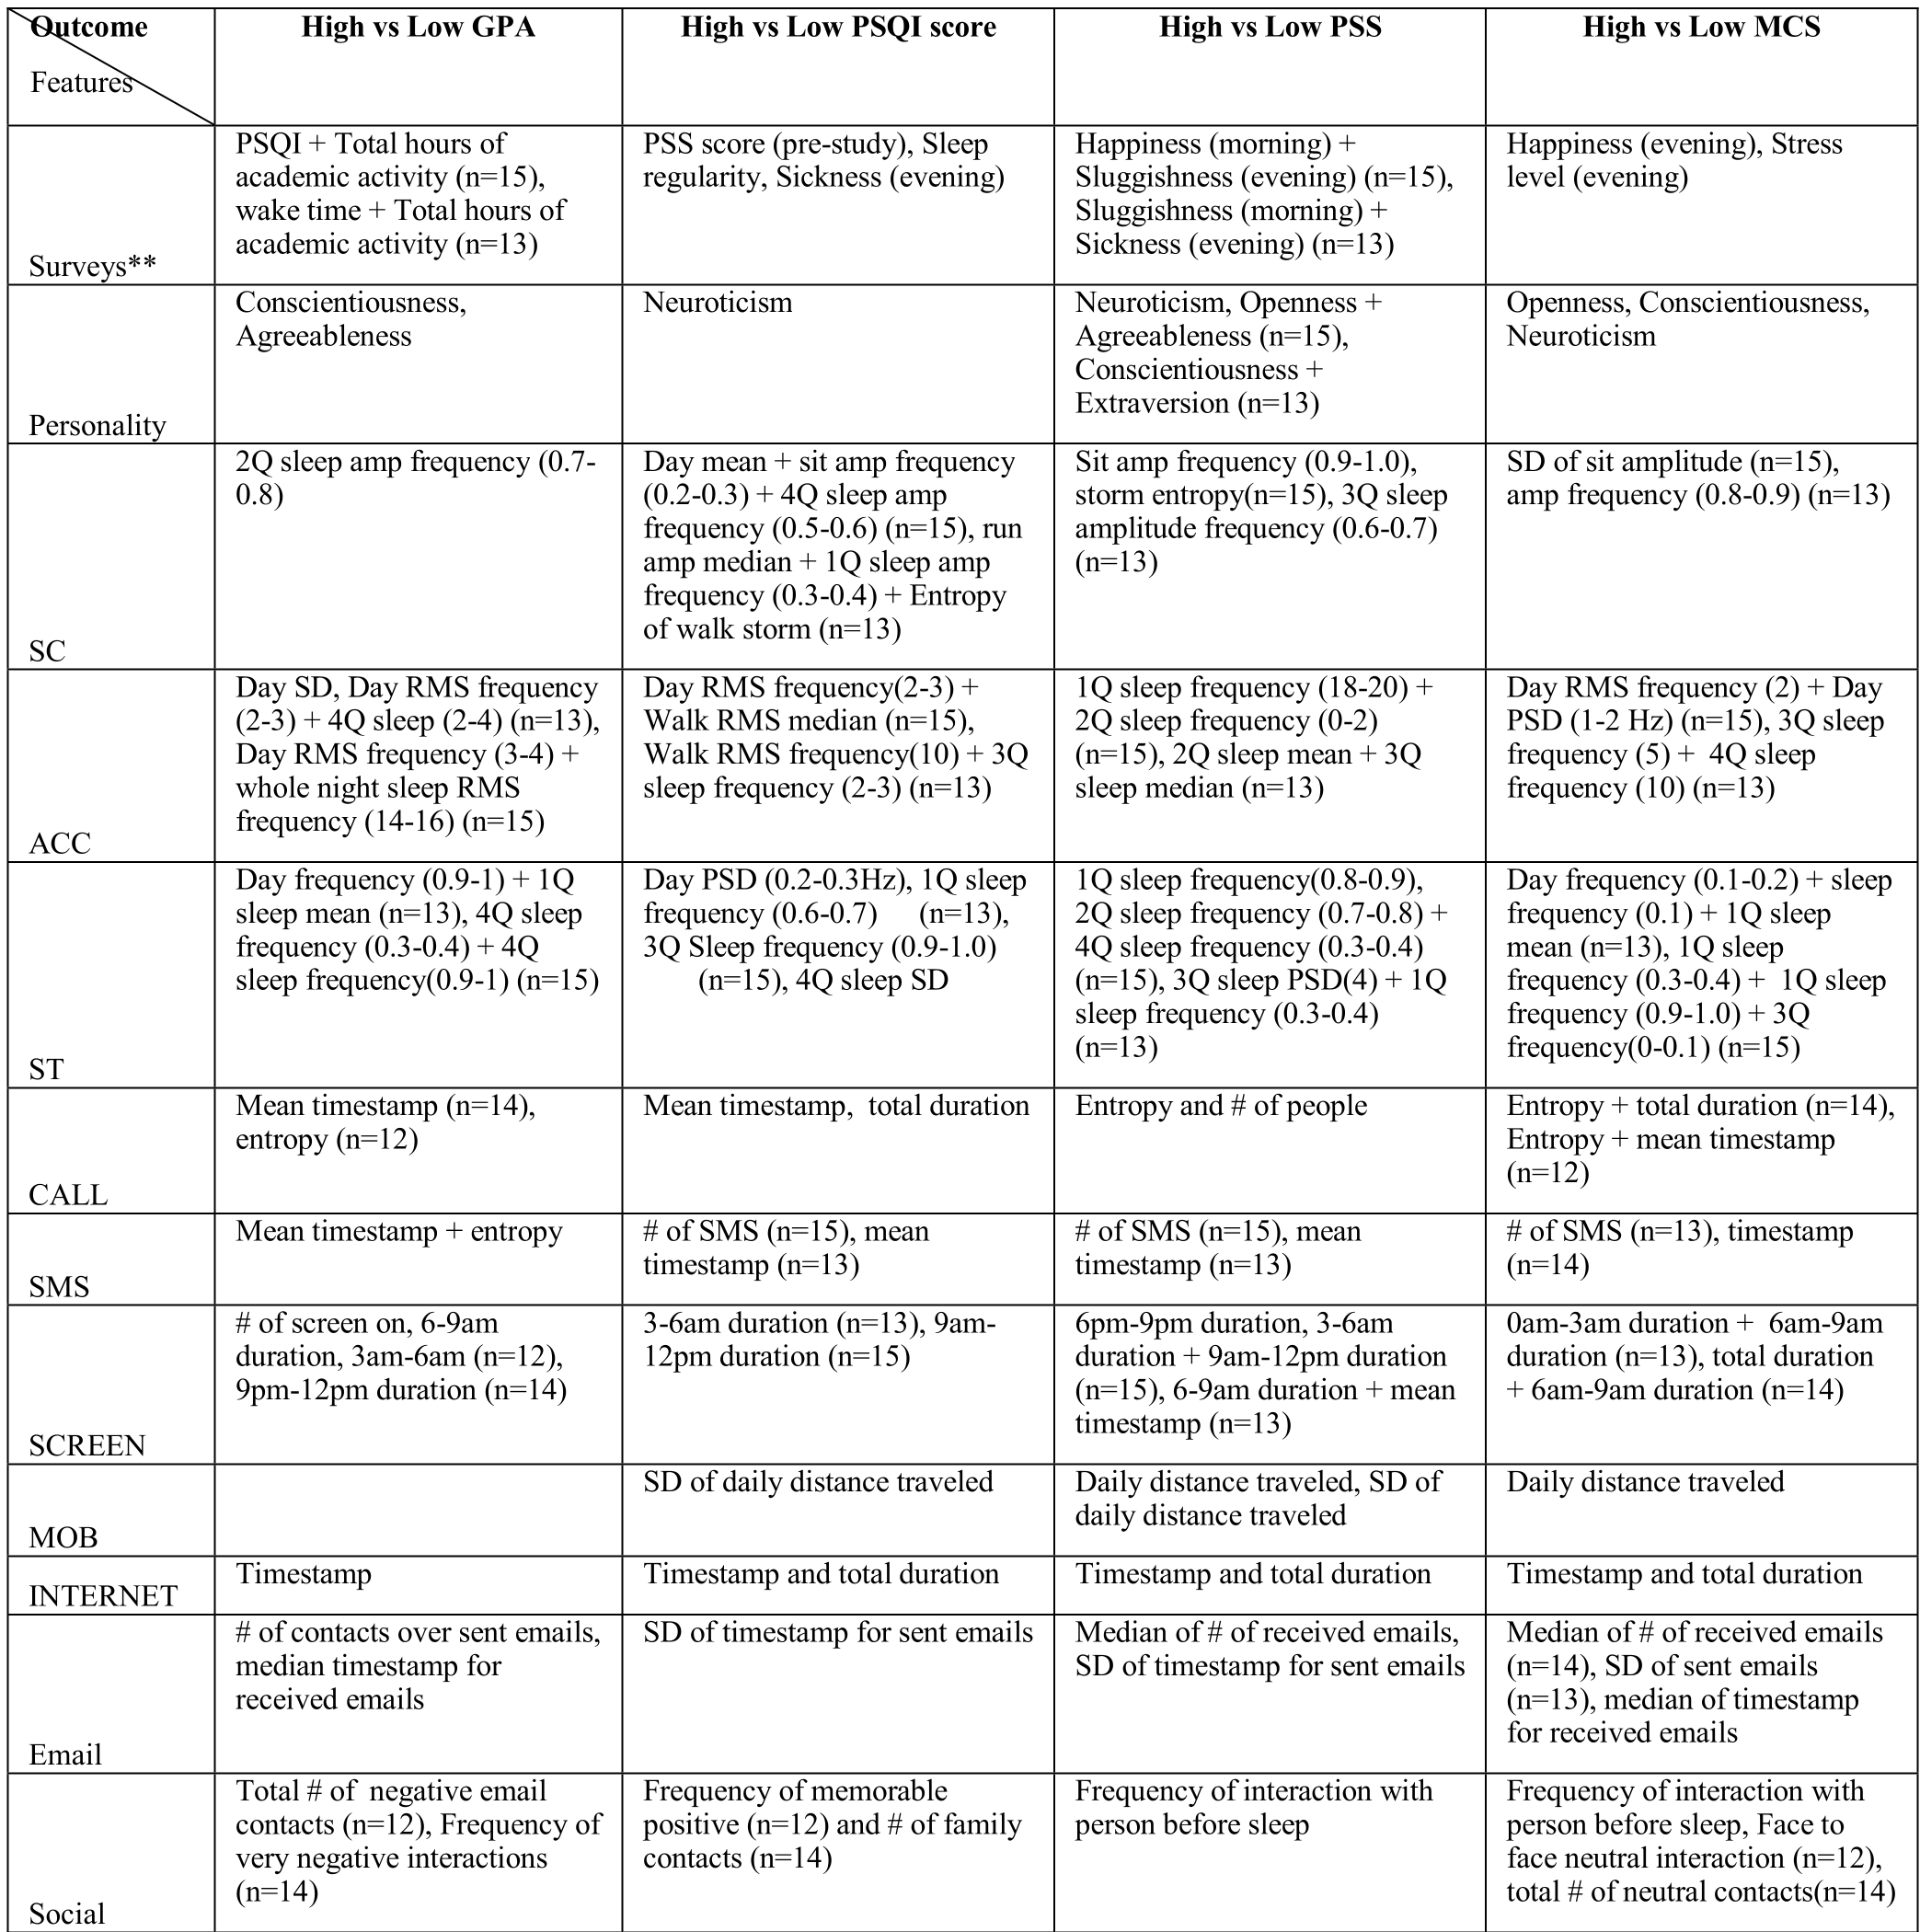 Table 2: The specific behavioral and physiological features that "won" the selection process for each outcome.
Critical Analysis & Future Outlook
This work successfully proves that we don't need invasive monitoring to understand mental health; the "exhaust data" from our daily technology use is sufficient.
Limitations:
- The sample size (n=66) is relatively small for broad generalizations across all student demographics.
- The "Black Box" nature of some physiological features (like specific SC frequency bins) requires more biological interpretation to be truly actionable for users.
The Takeaway: In the future, your phone might nudge you: "You've been active on your screen at 4 AM for three nights; your predicted stress level for next week has risen by 20%. Consider a digital detox to protect your GPA." This study is a cornerstone in making that proactive, personalized health future a reality.