
Intelligent Stewardship: Spatial Data Mining for Regional Ecological Conservation
Regional Ecological Environment Spatial Data Mining Based on GIS and RS: A Case Study in Zhangjiajie, China
This paper establishes a comprehensive theoretical framework for Regional Ecological Environment Spatial Data Mining (REESDM) using Geographic Information Systems (GIS) and Remote Sensing (RS). Applied to Zhangjiajie, China, the research integrates multi-source data to perform quantitative ecological sensitivity evaluation and functional regionalization to support sustainable regional development.
TL;DR
This research presents a robust framework for Regional Ecological Environment Spatial Data Mining (REESDM). By merging GIS (Geographic Information Systems) and RS (Remote Sensing), the authors transform raw spatial data into a strategic roadmap for Zhangjiajie, China. The study identifies critical ecological sensitivities and divides the region into seven functional zones to harmonize rapid tourism growth with environmental sustainability.
Background: The Tourism-Ecology Paradox
Zhangjiajie is a world-renowned tourist destination, famous for its Quartz Sandstone Peak Forests. However, its success is a double-edged sword. Between 1989 and 2005, its GDP surged by 15.8% annually, putting immense pressure on its karst landscape. The core challenge addressed here is: How can a region maintain such growth without triggering irreversible ecological collapse?
The authors argue that the solution lies in "mining" spatial data—not just collecting it, but extracting implicit, useful knowledge about how the environment reacts to human interference.
Methodology: The Four-Layer Mining Framework
The paper proposes a structured approach to transition from raw pixels to policy decisions.
1. The Theoretical Framework
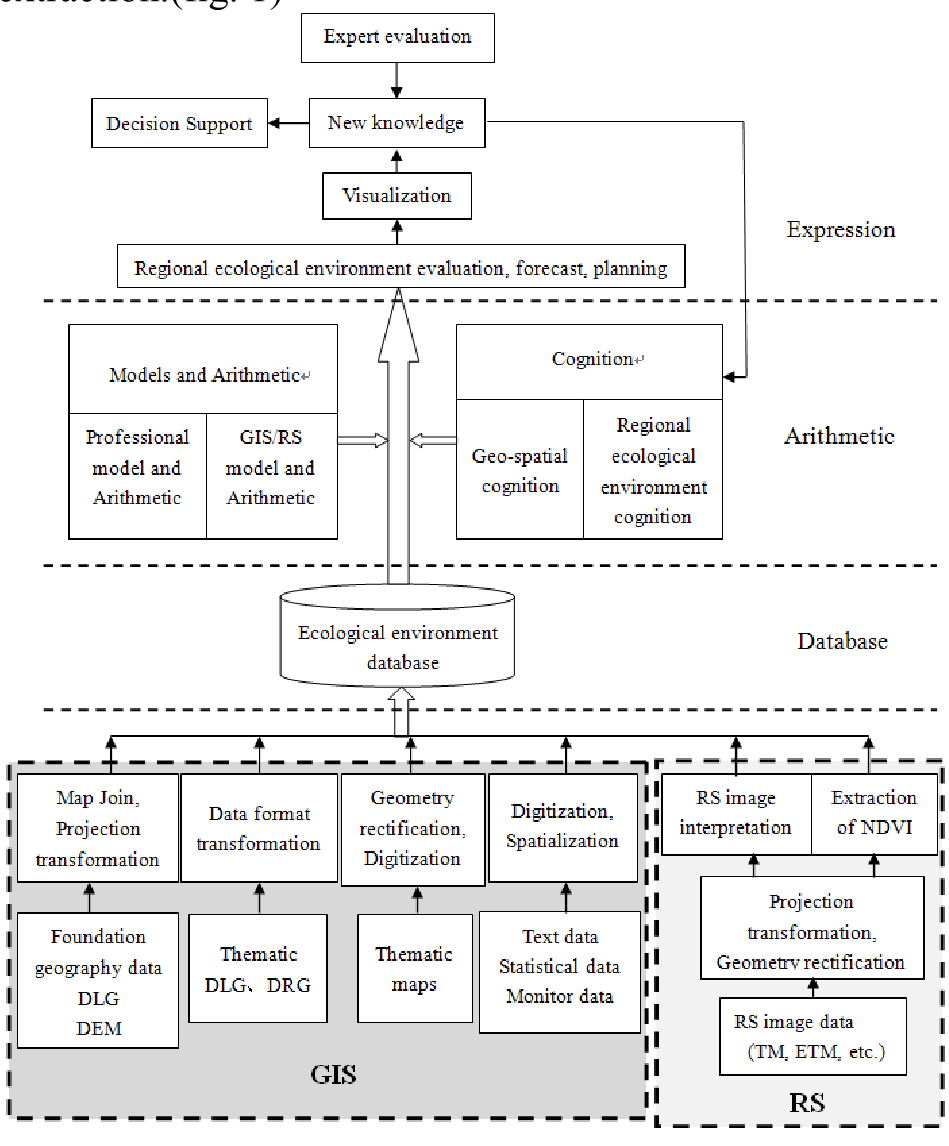
The REESDM framework consists of four layers:
- Data Sources: Combining Digital Elevation Models (DEM), Digital Line Graphics (DLG), and Remote Sensing images (TM/ETM).
- Database (REEDB): A unified repository where multi-source data is standardized and georeferenced.
- Algorithm Layer: The "brain" of the operation, utilizing GIS models and the Analytic Hierarchy Process (AHP).
- Expression Layer: Visualization tools that turn complex data into maps for decision-makers.
2. Quantitative Sensitivity Evaluation
The researchers used a Comprehensive Index Equation to calculate sensitivity (): Where represents the weight of specific factors (Terrain, Hydrology, Vegetation, Biodiversity, and Soil) and represents the normalized index.
Through AHP, they found that Biodiversity () and Terrain () were the most significant drivers of ecological sensitivity in Zhangjiajie, reflecting the area's status as a biological haven with complex, steep topography.
Results & Functional Mapping
The mining process yielded a high-resolution Ecological Sensitivity Distribution Map. This visualization is critical because it identifies exactly where the land is most vulnerable to soil erosion and habitat loss.
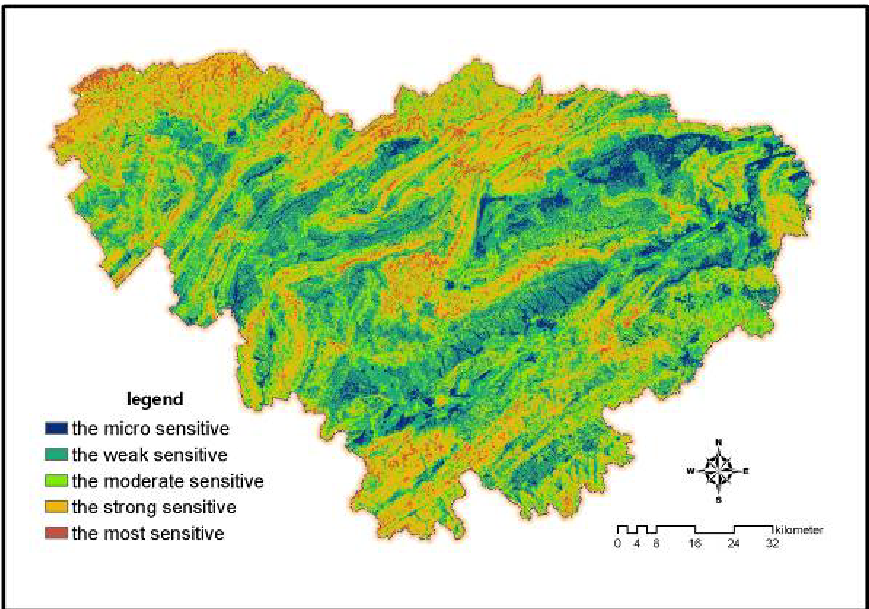
Based on this data, the region was divided into:
- Strictly Protected Zones: Mountains, nature reserves, and water headers.
- Development Zones: Urban centers and valley zones directed toward leisure travel and ecological conservation.
- Agricultural Zones: Hills and hillocks suitable for environmental-friendly farming.
Deep Insights: Beyond Simple Mapping
What sets this work apart is the shift from descriptive GIS to prescriptive data mining. The researchers didn't just map "where things are"; they modeled "how things change."
By identifying that 75.9% of the area is mountainous and assessing the vertical distribution of vegetation, the paper provides a scientific basis for the Ecological Function Regionalization. This ensures that tourism infrastructure is not built on highly sensitive limestone strata, which are prone to desertification.
Conclusion & Future Outlook
The study concludes that as mountainous regions face increasing human disturbance, multi-factor spatial data mining is the only way to ensure "rational development."
Limitations: While the logic is sound, the model relies heavily on the accuracy of AHP weights, which involve subjective expert judgment. Future iterations might benefit from integrating Automated Machine Learning (AutoML) to identify non-linear relationships between variables that human experts might overlook.
Takeaway for Practitioners
For urban planners and environmental scientists, this paper serves as a template for building a "Regional Ecological Brain"—a system that doesn't just store data but actively guides sustainable land-use policy.