
Filling the Gaps: Seamless Chlorophyll Monitoring via Multisensor Kriging
7391_Regional Objective Analysis for Merging High-Resolution MERIS, MODISAqua, and SeaWiFS Chlorophyll- a Data From 1998 to 2008 on the European Atlantic S
This paper presents a geostatistical "kriging" framework to merge high-resolution (1.1 km) Chlorophyll-a (chl-a) data from MERIS, MODIS/Aqua, and SeaWiFS sensors. By interpolating daily chl-a anomalies instead of absolute values, the method produces cloud-free daily fields for the European Atlantic Shelf (1998–2008), achieving a seamless spatiotemporal record for environmental monitoring.
TL;DR
Researchers have developed a sophisticated geostatistical method to merge data from three major satellite sensors (MERIS, MODIS, and SeaWiFS) to create a continuous, cloud-free record of Chlorophyll-a (chl-a) levels across the European Atlantic Shelf. By focusing on "anomalies" and utilizing local, seasonal variability models, they have turned fragmented satellite snapshots into a high-frequency (daily), 1.1 km resolution tool for environmental monitoring and regulatory compliance.
Background: The Cloud Problem in Ocean Color
Satellites like MODIS and SeaWiFS are our primary eyes on the ocean's "primary production"—the phytoplankton that forms the base of the food chain. However, these sensors rely on visible light, meaning they cannot see through clouds. On any given day, the European Atlantic Shelf might only have 15-30% spatial coverage. This "patchiness" makes it nearly impossible to track fast-moving biological events like spring blooms or to provide the consistent data required by the European Union’s Water Framework Directive (WFD).
The Problem & Motivation
Previous attempts to merge data often suffered from sensor-specific biases or struggled with the "Case 2" waters common in coastal areas, where sediments and dissolved organic matter interfere with the light signal. Simply averaging data doesn't account for the spatial and temporal correlations inherent in ocean processes. The authors recognized that to create a truly useful product, they needed a method that:
- Eliminated sensor bias without complex cross-calibration.
- Handled the non-stationary nature of the ocean (coastal waters are far more volatile than the open sea).
- Provided an estimate of uncertainty (how much can we trust the interpolated data?).
Methodology: Kriging the Anomalies
The central pillar of this work is Kriging, a geostatistical interpolation method that provides the "Best Linear Unbiased Predictor."
1. The Power of Anomalies
Instead of interpolating the raw chl-a values, which vary wildly by season and distance from shore, the authors calculate the chl-a anomaly: Using anomalies makes the data more "isotropic" (behaving similarly in all directions), which simplifies the math and improves accuracy near complex shorelines.
2. Local Semivariograms
Standard kriging assumes the same rules of variability apply everywhere. This paper introduces Local Semivariograms. The authors divided the ocean into subregions and found a "proportionality effect": the variance (Sill) and the noise (Nugget) are highly correlated with the square of the mean chlorophyll concentration. This allow the model to automatically adjust its "sensitivity" as it moves from the clear open ocean to murky, high-growth coastal zones.
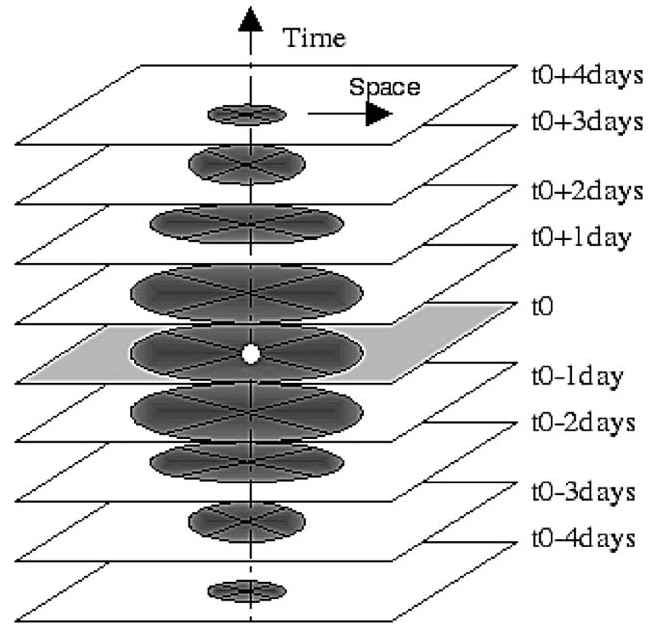 Figure 1: The sampling strategy for kriging, scanning decreasing disks in space and time to find the most relevant observations.
Experiments & Results: Real-World Validation
The method was tested against a massive dataset of in situ (on-site) measurements from 14 coastal stations and various research cruises from 1998 to 2008.
- Coverage Boost: Matchups with in situ station data jumped from ~1,000 (individual sensors) to nearly 4,000 (merged product).
- Precision and Accuracy: The analysis showed that the merged product was statistically equivalent to the original "pure" satellite data in terms of error, but with none of the gaps.
- Indicator Success: For the WFD, the 90th percentile (P90) is used to flag eutrophication risks. The merged product achieved a correlation of 0.96 with in situ P90 values.
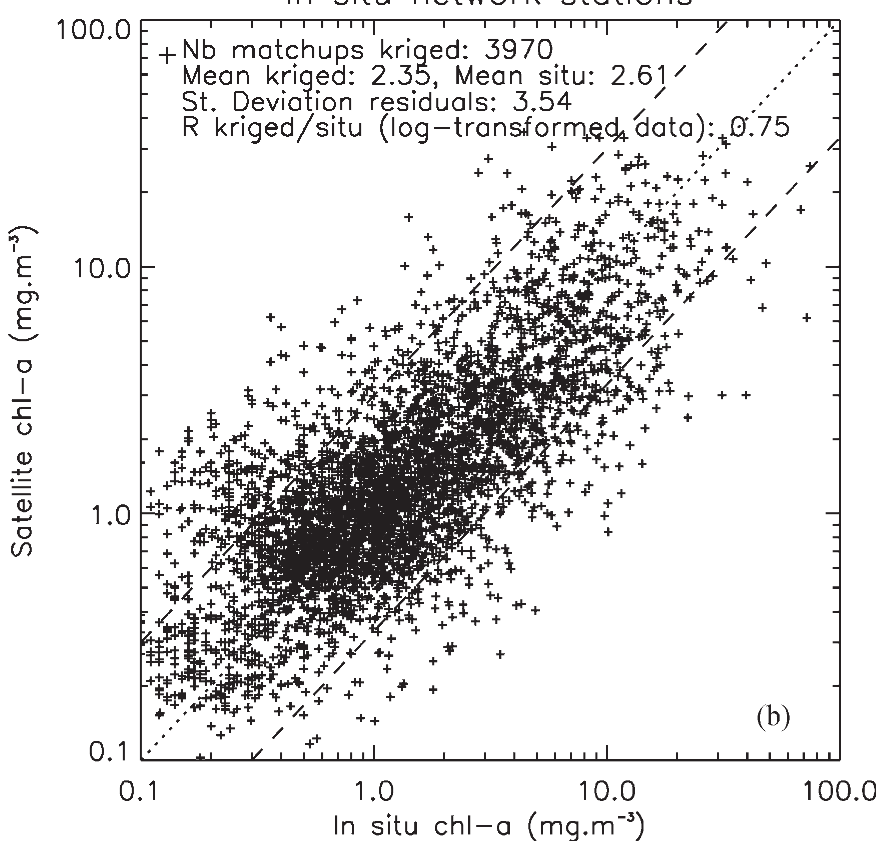 Figure 2: Scatterplots showing the strong agreement between the multisensor analysis and cruise/station data.
Monitoring Phytoplankton Blooms
A standout success was the ability to capture blooms that were missed by bi-weekly in situ sampling. In the Boulogne harbor (2007), the analysis correctly identified a massive spring bloom (25 mg/m³) during a period when persistent cloud cover blinded the individual MODIS and MERIS sensors.
Critical Analysis & Conclusion
The beauty of this approach lies in its physical intuition. By tying the statistical parameters of the kriging model to the climatological background, the authors reflect the biological reality that where life is more abundant, it is also more variable.
Limitations:
- The method assumes isotropy (uniformity in all directions), which might ignore some directional current-driven transport.
- While it provides an "error map," this map reflects spatial/temporal density of data, not necessarily the inherent sensor measurement error.
Takeaway: This work represents a shift from "remote sensing as a series of photos" to "remote sensing as a continuous data stream." It has already been implemented in operational services like Previmer, providing a vital tool for coastal management and climate research in Europe.