
Decoding Patient Safety: A Machine Learning Approach to Healthcare Culture
Reliability Engineering and System Safety
This study utilizes a Random Forest (RF) machine learning algorithm to analyze hospital-level aggregate data from 677 U.S. hospitals, aiming to identify the key dimensions of Patient Safety Culture (PSC) that drive overall patient safety grades. The research establishes that "Safety Perception," "Management Support," and "Supervisor Expectations" are the primary predictors of safety outcomes.
TL;DR
Researchers have successfully applied the Random Forest (RF) algorithm to quantify the impact of organizational culture on patient safety. By analyzing data from nearly 700 U.S. hospitals, the study reveals that management support and supervisor expectations are not just "soft" metrics but quantifiable drivers that significantly predict a hospital's overall safety grade.
Context: Why "Culture" is a Data Science Problem
In safety-critical industries, "the way we do things around here" (culture) is often the difference between a near-miss and a catastrophe. In healthcare, Patient Safety Culture (PSC) is traditionally measured via the HSOPSC (Hospital Survey on Patient Safety Culture) survey. However, the industry has long struggled with a "What now?" problem: when you have 42 different survey variables, which one do you fix first?
Most prior studies relied on simple averages or linear regressions. These tools are often too blunt to handle the "Inductive Bias" inherent in human behavior—where one poor leadership behavior might diminish the positive impact of ten good safety protocols.
Methodology: The Power of the Forest
The researchers chose a Random Forest approach because of its ability to handle high-dimensional data and cross-correlation without the rigid assumptions of linear models.
The Two-Stage Architecture
The study was structured into two distinct analysis levels:
- Stage 1 (Composite Level): Assessing 12 broad dimensions (e.g., Teamwork, Staffing, Handoffs).
- Stage 2 (Attribute Level): Analyzing 42 specific survey questions to find the "smoking gun" variables.
To ensure the model wasn't just finding noise, the team used an Exhaustive Grid Search to tune hyper-parameters such as tree depth and leaf size, optimizing for Mean Absolute Error (MAE).
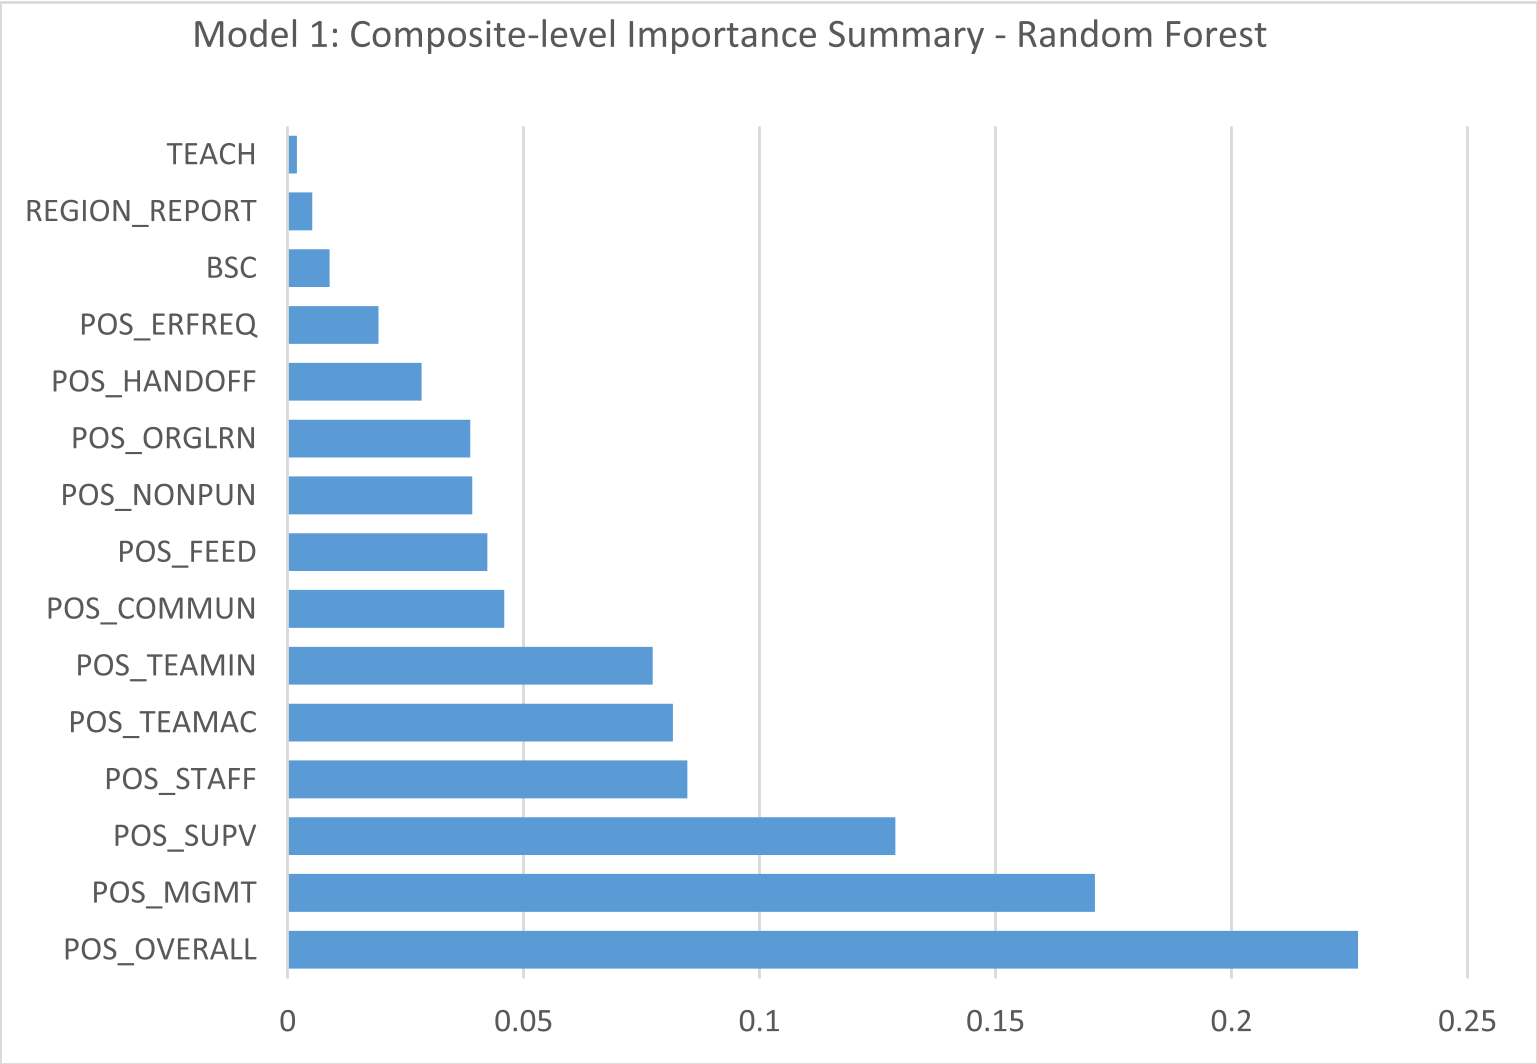 Fig 1: Composite-level importance summary showing the dominance of Safety Perception and Management Support.
Key Insights: What Actually Drives Safety?
The results provide a data-driven roadmap for hospital executives.
1. The "Management Support" Multiplier
The model found that Management Support for Patient Safety and Supervisor Expectations are the most critical predictors. This validates the "Top-Down" theory of safety: if management doesn't provide a climate that promotes safety as a priority over efficiency, front-line protocols will likely fail.
2. The Power of Item A17
In the granular analysis, a single question (A17: "We have patient safety problems in this unit") accounted for over 50% of the predictive importance. This suggests that front-line staff have a highly accurate intuitive "sensing" of unit safety that is captured by this specific prompt.
 Fig 2: Item-level importance analysis highlight the disproportionate weight of perceived safety problems (A17).
Performance Metrics
The Random Forest model demonstrated robust stability:
- MSE (Mean Square Error): 0.01
- MAPE (Mean Absolute Percentage Error): ~22-23%
- Reliability: All composites surpassed the 0.70 Cronbach’s alpha threshold, proving that the data fed into the RF model was highly consistent.
Critical Analysis & Future Outlook
While this work is a breakthrough in applying Advanced Analytics to healthcare operations, it has limitations. The data is hospital-level aggregate; a unit-level analysis might reveal even more variance (e.g., intensive care vs. pharmacy).
The Takeaway for Practitioners
This study proves that safety culture is not a "black box." By using tree-based algorithms, we can rank cultural features and prioritize resource allocation. The core message is clear: to move the needle on patient safety, healthcare leaders must move beyond measuring teamwork alone and focus on visibility, responsiveness to staff suggestions, and the active creation of a safety-first work climate.
Conclusion
The marriage of machine learning and safety survey data represents a paradigm shift. Moving forward, the goal should be to integrate these predictive "cultural signatures" with real-time incident reporting to create a proactive, rather than reactive, patient safety system.