
Precise Node Centrality: Estimating Importance in Large Graphs with Resampling
Resampling-Based Framework for Estimating Node Centrality of Large Social Network
The paper introduces a "Resampling-Based Framework" for efficiently estimating node centrality (Closeness and Betweenness) in large-scale social networks using partial uniform sampling. By deriving a closed-form "Resampling Error" (RE) formula, the authors provide a tighter, finite-population-corrected confidence interval for centrality values compared to traditional i.i.d-based standard error.
TL;DR
Large social networks make the calculation of global node centralities (like Closeness and Betweenness) extremely slow. While researchers often use sampling to speed this up, traditional statistical error bounds are "loose" because they assume the data is drawn from an infinite pool. This paper introduces a Resampling-Based Framework that uses finite population correction to provide much tighter and more accurate error estimates, allowing researchers to identify top-ranked nodes with 95% confidence using only 20% of the network nodes.
Problem & Motivation: The "Infinite" Mistake
In social network analysis, "Centrality" determines which nodes are the "hubs" or "influencers." Approaches like Closeness and Betweenness require scanning the entire graph structure. For a network with millions of users, this is a computational nightmare.
Sampling is the obvious solution, but it introduces Approximation Error. Typically, we use the Standard Error (). However, the authors point out a fundamental flaw: Standard Error assumes the data comes from an independent and identically distributed (i.i.d.) infinite source. In a real social network, the population is finite. If you sample 100% of a network, your error should be zero. Standard Error formulas, however, still predict a positive error at 100% coverage. This lack of "tightness" makes it hard to trust rankings derived from small samples.
Methodology: The Resampling Insight
The core contribution is a mathematical derivation of Resampling Error (RE). Instead of the i.i.d. assumption, the authors consider the family of all possible partial networks of a fixed size.
The Formula
The authors prove that the expected error can be simplified to: Where the coefficient is defined as: (L = total nodes, N = sampled nodes)
Contrast this with the standard coefficient . Note that as , goes to 0, while does not. This "Finite Population Correction" is what allows the error bound to be much tighter.
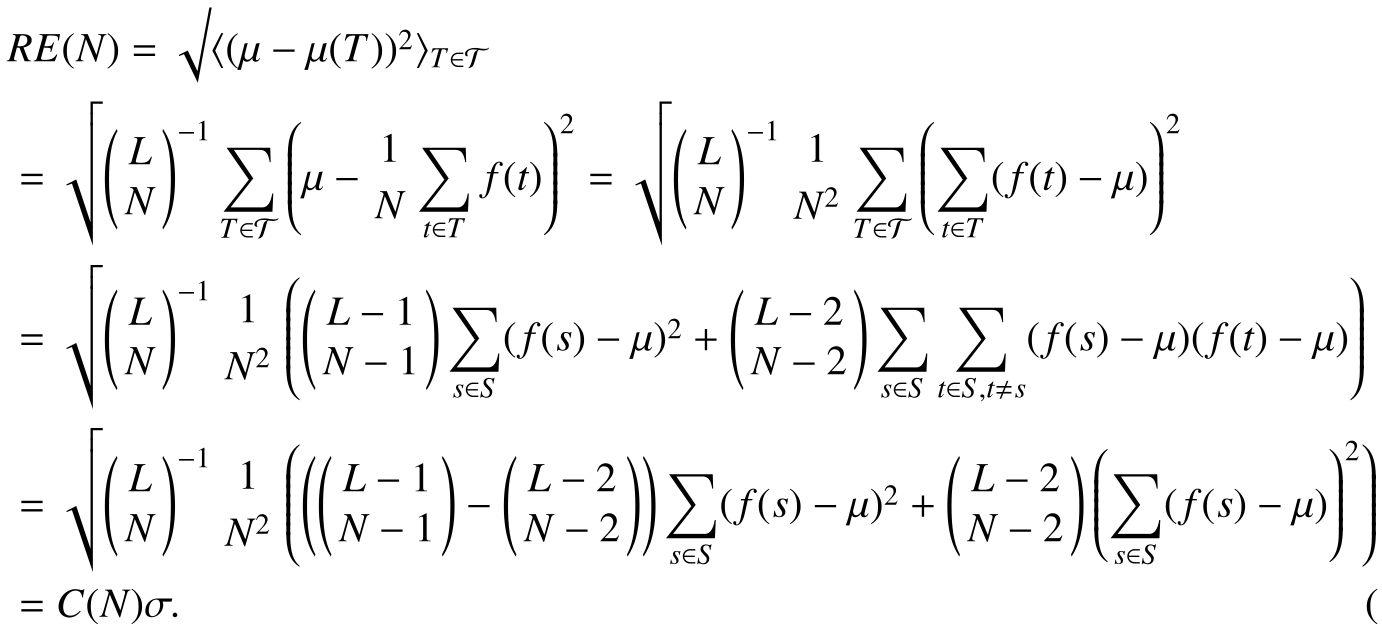
The authors specifically adapt this to:
- Closeness Centrality: Using the Burning Algorithm on a reversed graph to estimate shortest paths.
- Betweenness Centrality: Using the Brandes Algorithm to estimate the fraction of shortest paths passing through a node.
Experiments & Results
The framework was tested on three real-world datasets: Ameblo (56k nodes), Cosme (45k nodes), and Enron (19k nodes).
Tighter Bounds
As shown in the performance comparison below, the Resampling Error (red dashed lines) hugs the actual estimated values (green jagged lines) much more closely than the Standard Error (blue chain lines).
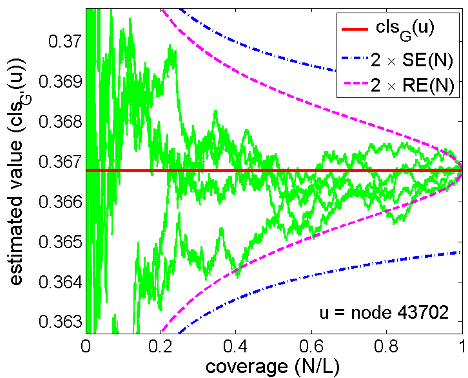 Fig 2: Closeness Centrality estimation. Notice how the RE bound converges to the true value at 1.0 coverage.
Ranking Stability
One of the most impressive findings is the ability to distinguish ranks. In the Ameblo network, the error bounds for the #1 and #2 ranked nodes do not overlap when coverage reaches 20%. This implies we can mathematically guarantee the ranking of top influencers without processing the remaining 80% of the network.
Convergence Analysis
When plotting the difference between estimated error and the true RMSE (Root Mean Squared Error), the proposed remains near zero, whereas the consistently overestimates the error as coverage increases.
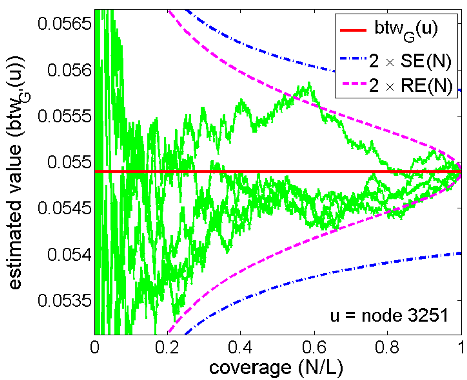 Fig 4: The red line (Resampling Error) stays flat near 0, showing high precision.
Critical Analysis & Conclusion
Takeaway
The resampling-based framework is a "meta-method." It doesn't replace existing sampling techniques (like MH-sampling); rather, it provides a superior way to measure the confidence of any uniform sampling result. For engineers building real-time social analytics, this means significantly lower infrastructure costs for identifying top nodes.
Limitations
- Uniform Sampling Requirement: The math relies on uniform sampling. If the sampling method is biased (e.g., BFS or Snowball sampling), the formulas need to be adjusted for those specific biases.
- Standard Deviation Estimate: The method assumes we can estimate the population standard deviation () from a small sample. While usually effective, in extremely skewed power-law graphs, a tiny sample might miss the high-variance nodes, leading to an underestimation of .
Future Outlook
The authors suggest this framework is generic. Beyond node centrality, it could be applied to any graph-based aggregation task, such as community detection stability or average clustering coefficient estimation, paving the way for high-speed, high-confidence network science.