
The Digital Mirror: Does ResearchGate Reflect Real-World University Prestige?
Research universities on the ResearchGate social networking site: An examination of institutional differences, research activity level, and social networks formed
This study investigates the relationship between institutional research activity levels and academic reputation metrics on ResearchGate (RG). By analyzing data from 61 U.S. universities across Carnegie classifications (R1, R2, R3), the authors demonstrate that RG metrics—specifically RG scores, citations, and followers—closely mirror the established research hierarchy of higher education institutions.
TL;DR
Is a high ResearchGate (RG) score just "digital noise," or does it reflect true academic excellence? A deep-dive study of 61 U.S. research universities reveals that RG is not just a social club; its metrics—including RG scores, citations, and follower counts—line up almost perfectly with official Carnegie Classifications (R1, R2, R3). R1 universities like Stanford and Harvard sit at the center of a digital "academic club," while others look to them for information, confirming that the digital hierarchy mirrors the physical one.
Motivation: Moving Beyond "Zombie" Users
For years, critics have dismissed Academic Social Networking Sites (ASNS) as platforms for "zombie" accounts or inflated reputations. However, as scholars increasingly use these platforms for sharing pre-prints and finding collaborators, the researchers behind this study wanted to know: Do institutional differences in the "real world" translate to the digital world?
The authors hypothesized that if RG is truly research-oriented, we should see a clear "staircase" effect in metrics as we move from moderate (R3) to highest (R1) research activity levels.
Methodology: Mapping the Academic Web
The researchers used a "train crawler" to harvest data from over 168,000 profiles, eventually filtering down to ~87,000 active users (those with an RG score ≥ 0.01).
1. The Metric Analysis
They compared three categories of indicators:
- Reputation Metrics: RG Score.
- Interaction Metrics: Profile views, followers, and followees.
- Publication Metrics: Total publications, reads, and citations.
2. The Network Analysis
By looking at who follows whom, the researchers constructed an institutional social network to see if universities form exclusive clusters.
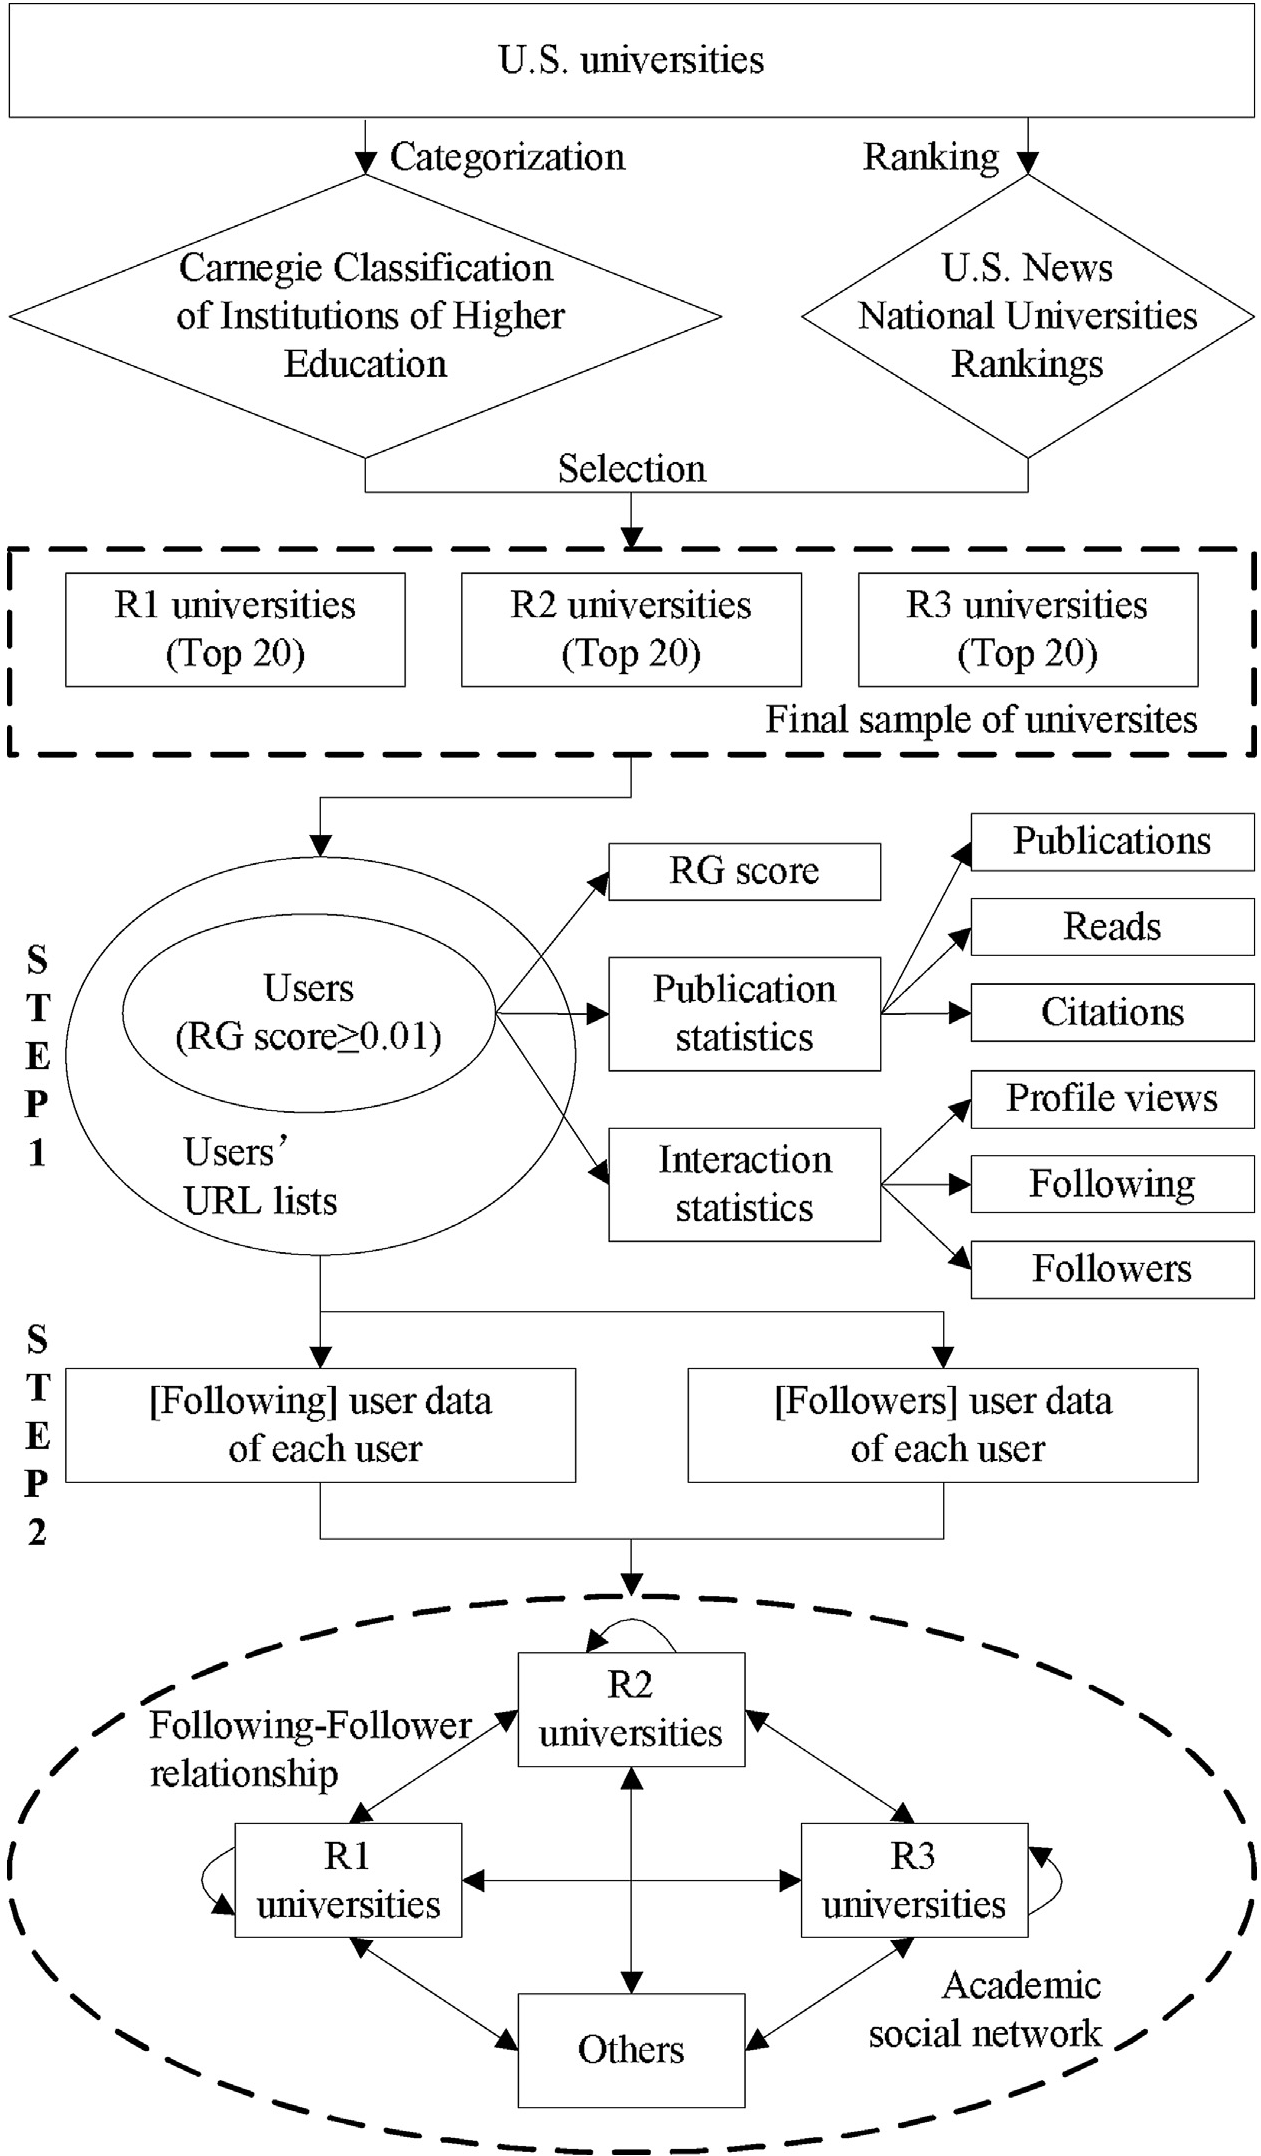 Figure 1: The data collection and processing flow utilized in the study.
Results: The "Academic Club" is Real
The findings confirm a significant "Institutional Difference" across the board:
- RG Score & Publications: R1 universities had a median RG score of 17.97, significantly higher than R2 (14.28) and R3 (11.71). The publication gap was even wider, with R1 users averaging nearly double the output of R3 users.
- The Follower Gap: Users from R1 universities attract far more attention (profile views and followers).
- The Outlier - "Reads": Interestingly, "Reads per publication" did not follow the hierarchy. R3 universities often had higher "reads," likely because they upload more full-text work or focus on more accessible, practitioner-oriented topics.
The Social Hierarchy (Network Analysis)
The most striking visualization is the "Institutional Social Network." Using the "ForceAtlas2" layout, the researchers showed that U.S. universities reside in three distinct concentric circles.
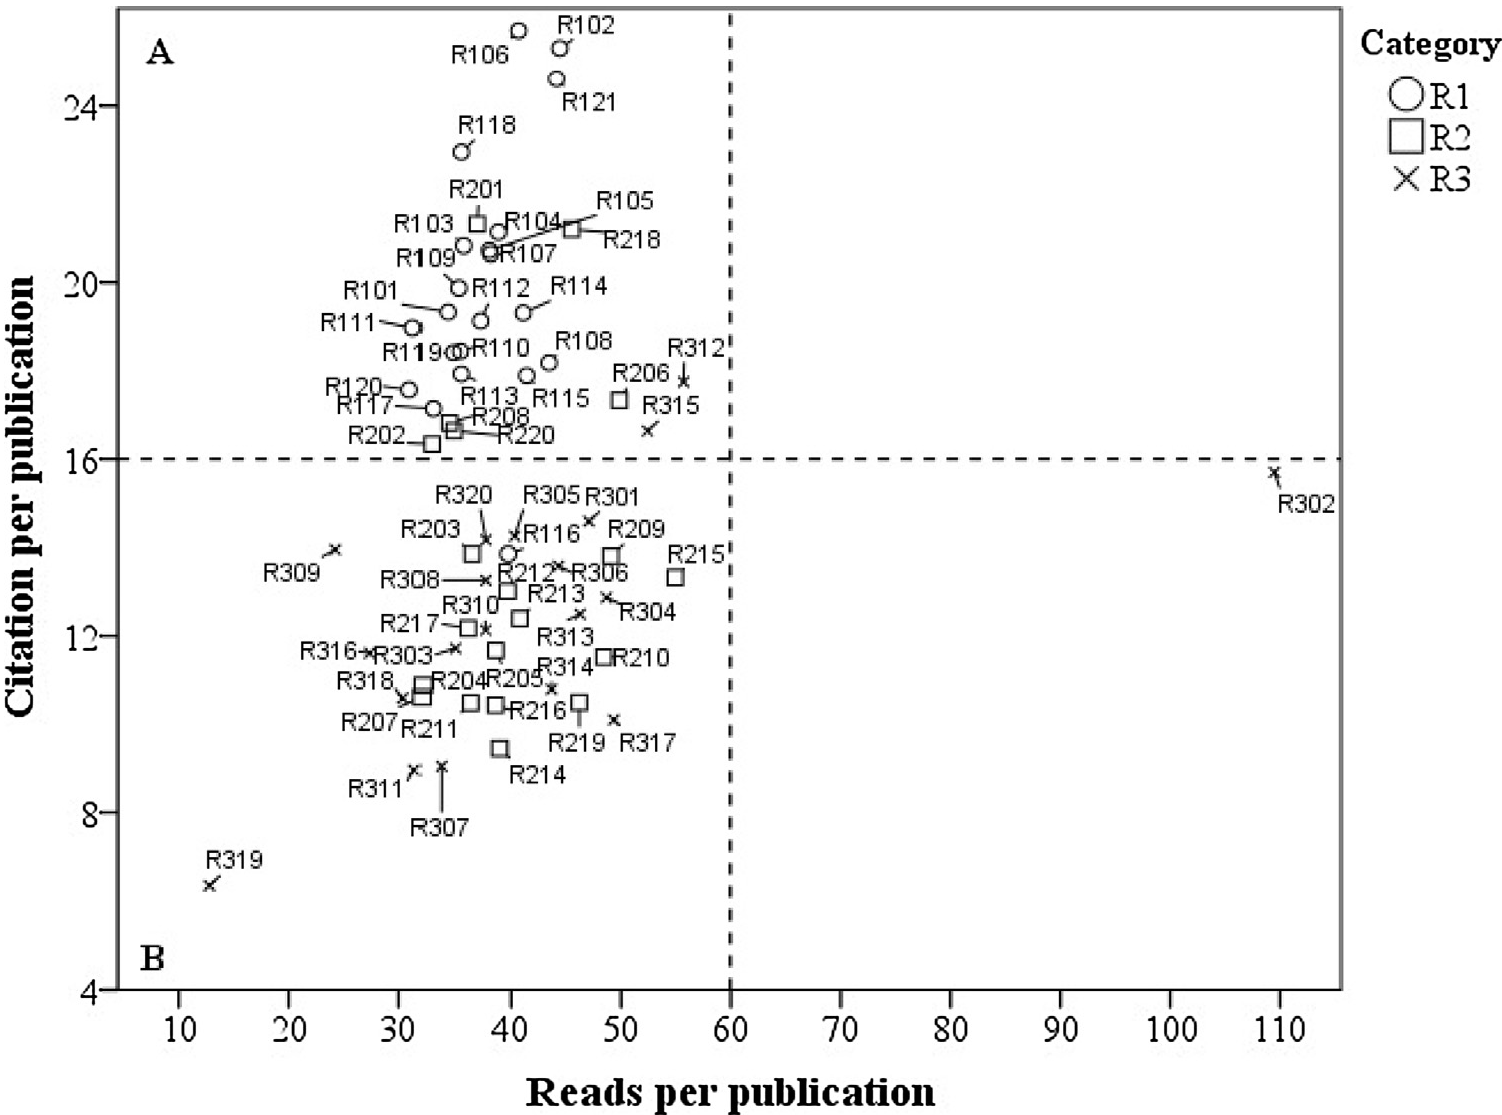 Figure 2: The follower-followee network showing R1 universities (blue) at the center, with R2 (green) and R3 (red) at the periphery.
Key Insight: Users from R2 and R3 universities spend most of their "following" energy looking up the ladder. Specifically, over 63% of R3 users' follows are directed at R1 institutions. This demonstrates that RG functions as an information-seeking tool for lower-tier universities to stay updated on the work of "esteemed institutions."
Critical Analysis & Takeaways
The study proves that RG metrics are not arbitrary. They reflect the intensity of research activity.
The "Matthew Effect"
The results provide a digital confirmation of the "Matthew Effect"—the sociological phenomenon where the "rich get richer" in terms of reputation. R1 universities have higher visibility, which leads to more followers, which leads to higher RG scores, further cementing their status in the digital ecosystem.
Limitations
- The Black Box: The exact algorithm for the RG Score remains a secret, making it hard to replicate exactly.
- Self-Selection: RG is voluntary. If the top scientists in a specific R3 university are hyper-active while their R1 counterparts are not, the data could shift.
Conclusion
For university administrators, ResearchGate is no longer just a "distraction." It is a legitimate tool for evaluating an institution's Altmetric footprint. By engaging with these platforms, institutions can promote their academic influence and tap into the "Academic Club" that defines modern scientific communication.