
Resource Sizing for MapReduce: Bridging the Gap Between SLOs and Cloud Provisioning
Resource Provisioning Framework for MapReduce Jobs with Performance Goals
The paper introduces a resource provisioning framework for MapReduce designed to meet specific Service Level Objectives (SLOs). It utilizes an automated profiling tool to extract job performance invariants and a scaling model to predict job completion times and determine optimal resource allocation (map/reduce slots) for large-scale datasets, achieving prediction accuracy within 10% of measured times.
TL;DR
Predicting how many nodes you need for a MapReduce job is often a game of "guestimation." This paper introduces a formal framework that profiles jobs on small data, uses linear scaling rules to project performance on large data, and provides a mathematical model to guarantee completion within a specific deadline (SLO), even in the face of hardware failures.
The "Guessing Game" of Cloud Resources
When moving MapReduce workloads to the cloud (like Amazon EMR), users face a paradox: the cloud offers "infinite" resources, but the wallet is not. If a business needs a spam detection report ready by 8:00 AM, how many instances should they lease?
Current methods rely on "rules of thumb" (e.g., "half the nodes, double the time"), which the authors prove are fundamentally flawed. For instance, in their tests, reducing a cluster by 4x only increased execution time by 2.8x, not 4x. This discrepancy happens because MapReduce phases (Map, Shuffle, Reduce) overlap and scale differently.
Methodology: The Anatomy of a Job Profile
The core innovation is the Job Profile. Instead of looking at total time, the authors break the job down into Performance Invariants—metrics that remain constant regardless of the cluster size.
1. Extracting Invariants
The framework tracks:
- Task Durations: Min, Avg, and Max for Map and Reduce tasks.
- Selectivity: The ratio of output data to input data (crucial for predicting shuffle traffic).
- Phase Overlaps: Specifically, the "First Shuffle" (which overlaps with Mapping) vs. "Typical Shuffle."
2. Linear Scaling Rules
The authors logically argue that while Map tasks are usually constant-sized (based on block size), Reduce tasks aggregate data. Therefore, as input data grows, the work per Reduce task increases. They use linear regression to model this: This allows the model to predict how long a task will take on 10TB of data based on observations from 10GB.
3. The Performance Model (The Logic)
Using the Makespan Theorem, the authors define upper and lower bounds for completion.
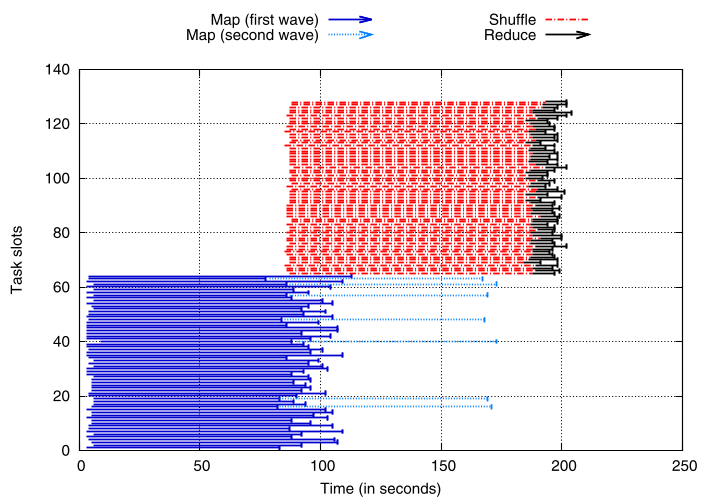 Fig 1: Visualizing task waves. Notice how the first Shuffle phase (blue) stretches across the Map waves.
Handling the "Real World": Failure Modeling
A highlight of this work is the Failure Impact Model. In a large cluster, node failures are a statistical certainty. When a node fails, its completed Map outputs are lost (because they were on local disk). The authors' model calculates the "Critical Path" delay caused by re-computing these lost fragments.
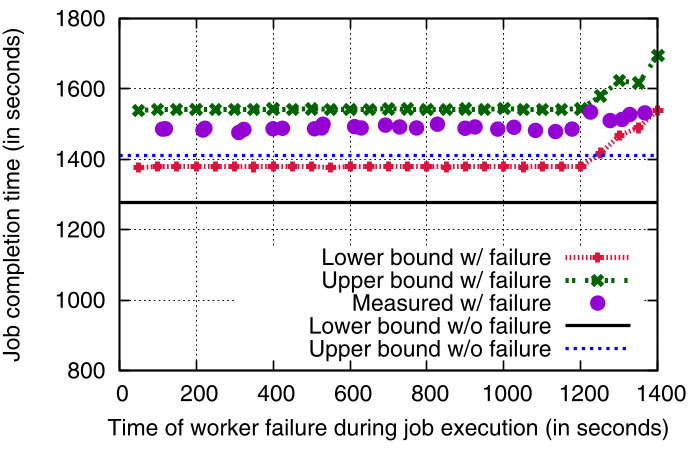 Fig 2: Failure impact at different stages. A failure near the end of the job (Reduce stage) is far more catastrophic than one at the beginning.
Experiments & Results
The authors tested their framework on a 66-node cluster using diverse apps: Twitter (graph processing), Sort, WikiTrends, and WordCount.
- Accuracy: The predicted completion times were within 10% of actual measured times.
- SLO Provisioning: The model successfully generated "Resource Curves." If you want a job done in 8 minutes, the model shows you have options: e.g., 64 Map slots/16 Reduce slots, or 40 Map slots/22 Reduce slots.
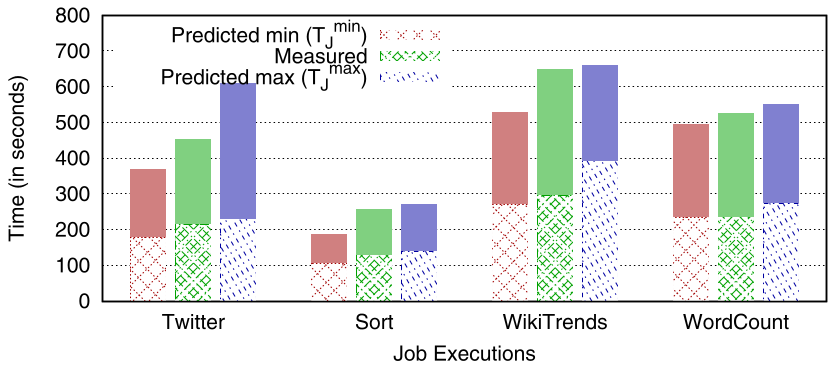 Fig 3: Comparison of predicted vs. measured times. The "Average" prediction (T_avg) consistently tracks the actual performance.
Critical Insight & Conclusion
The true value of this paper lies in its simplicity and portability. By treating a MapReduce job as a sequence of waves and using the Makespan Theorem, the authors avoided the need for complex simulations or neural networks, which were common in contemporaneous research.
Takeaway for the Industry: For cloud providers, this represents a path toward "guaranteed performance" instances. For users, it provides a mathematical shield against over-provisioning costs while ensuring that critical data pipelines meet their deadlines.
Limitations
- Network Bottlenecks: The model assumes the network is not a primary bottleneck (common in over-provisioned data centers but not all clouds).
- Static Configuration: The profiling assumes specific Hadoop parameters (like block size) remain constant.