
ITrace: Bridging the "Social Gap" in Requirements Traceability
A rich traceability model for social interactions
The paper introduces ITrace, a graph-based traceability model that bridges the gap between Requirements Engineering (RE) artifacts and the social interactions that produce them. By utilizing RichPicture notation, it provides a semi-formalized framework to track social networks, interaction goals, and artifact evolution simultaneously.
TL;DR
Requirements Engineering (RE) is fundamentally a social process, yet most traceability tools treat it as a cold sequence of document versioning. ITrace changes this by introducing a three-layered graph model that treats software engineers, their interactions, and even their "concerns" as first-class citizens. By weaving together social graphs with artifact evolution, it provides a holistic "Why" behind software changes.
Problem & Motivation: The Missing Human Element
Since the early 90s, research by Goguen and others has highlighted that social issues—like lack of commitment or poor communication—are the root causes of many RE failures. However, current SOTA (State Of The Art) traceability metamodels focus almost exclusively on Backward Traceability (linking requirements to stakeholder goals) or Forward Traceability (linking requirements to code).
The "missing middle" is the social interaction within the development team. Most models ignore the software engineer's role. If a requirement changes during a brainstorm, traditional logs tell us what changed, but ITrace seeks to document the specific social interaction, the technique used (e.g., brainstorming), and the underlying concerns of the individuals involved.
Methodology: The Three-Layered Graph
ITrace defines traceability as a set of graphs weaved together: .
- Layer B (Base Graph): Represents the social network (who is a "student of" or "collaborates with" whom) and the raw information sources.
- Layer I (Interaction Graph): Captures the specific events—meetings, activities, and techniques—and the goals of those interactions.
- Layer A (Artifact Graph): Shows the actual evolution of RE artifacts, such as goal models or Transparency Catalogues.
Architecture Deep Dive
The most striking feature is the use of RichPicture notation. Unlike rigid UML diagrams, ITrace allows for "thought bubbles" and informal icons.
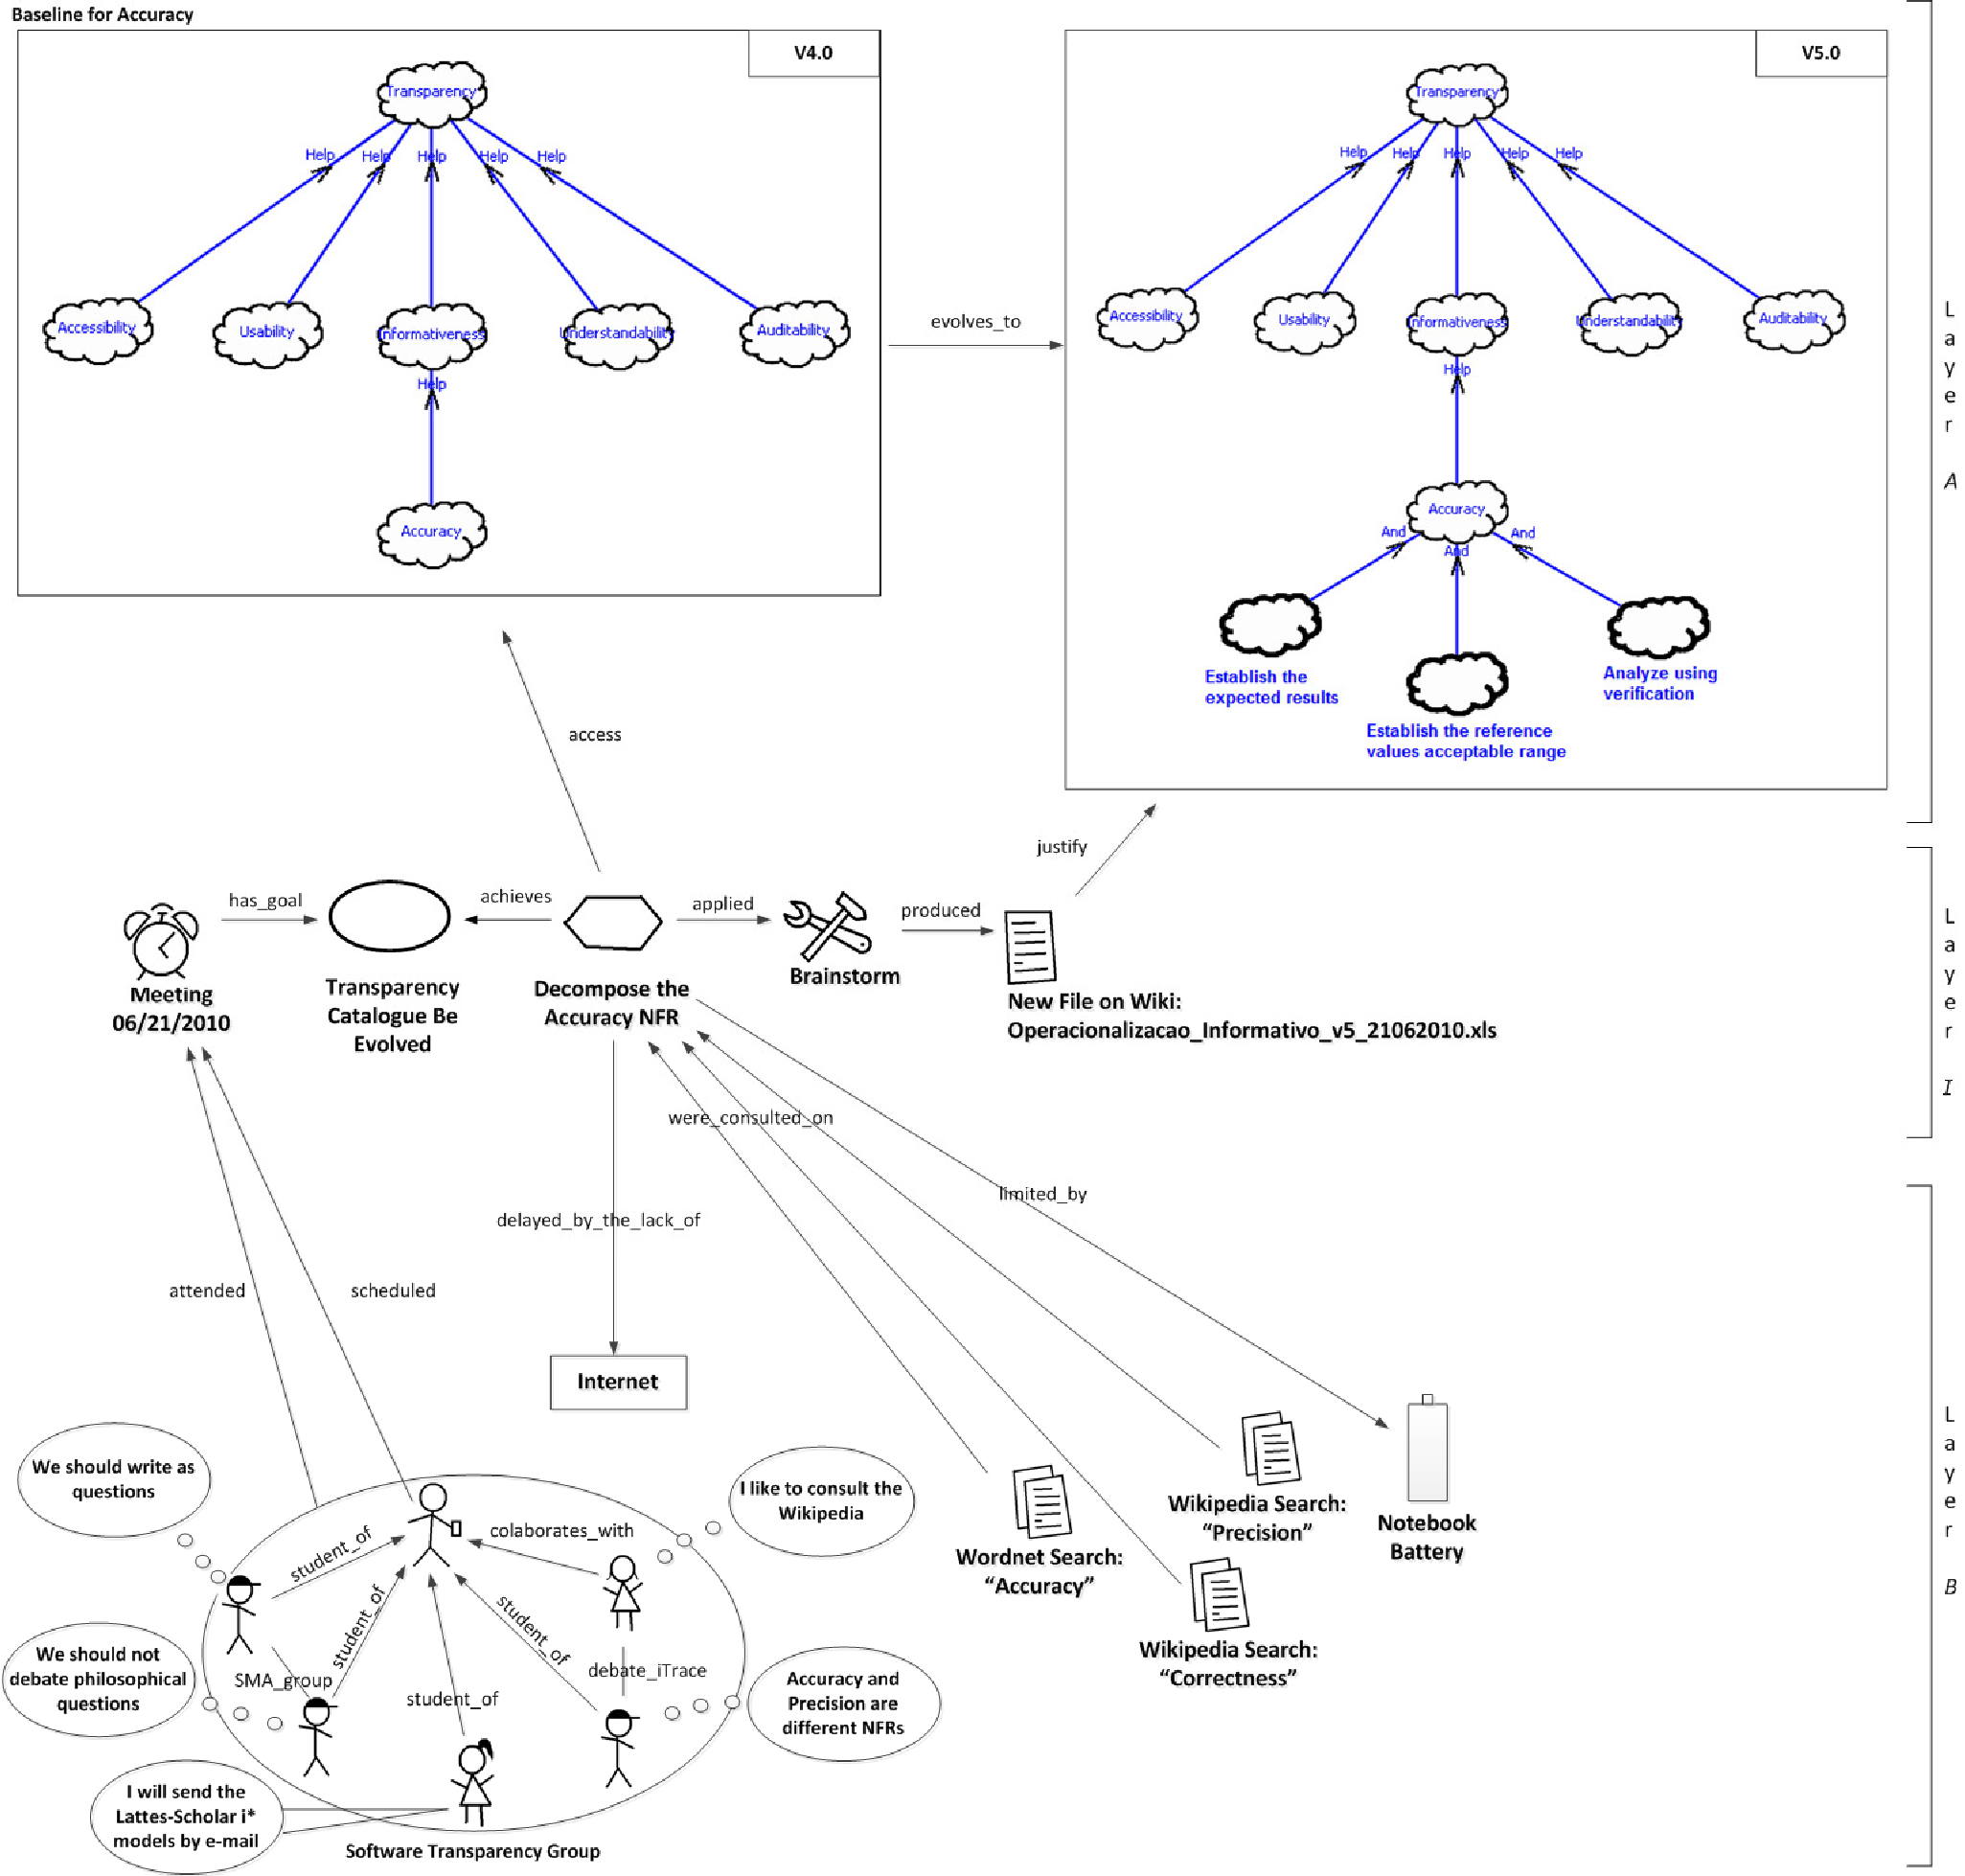 Figure 1: Notice how Layer B captures human concerns (thoughts), Layer I captures the activity timeline, and Layer A shows resulting model changes.
Experimental Validation: Transparency in Practice
The authors tested ITrace over nine months while developing a Transparency Catalogue.
- Participants: A mix of 16 PhDs and students.
- Efficiency: Modelers required less than one hour of training to start capturing complex social-technical traces "on the fly" during meetings.
- Insight: The model captured unusual but vital context, such as a "Notebook Battery" limit affecting a brainstorming session, which would be lost in any other traceability system.
The evolution of the models is tracked not just linearly, but through branches and versions, ensuring that the history of "how we got here" is never lost.
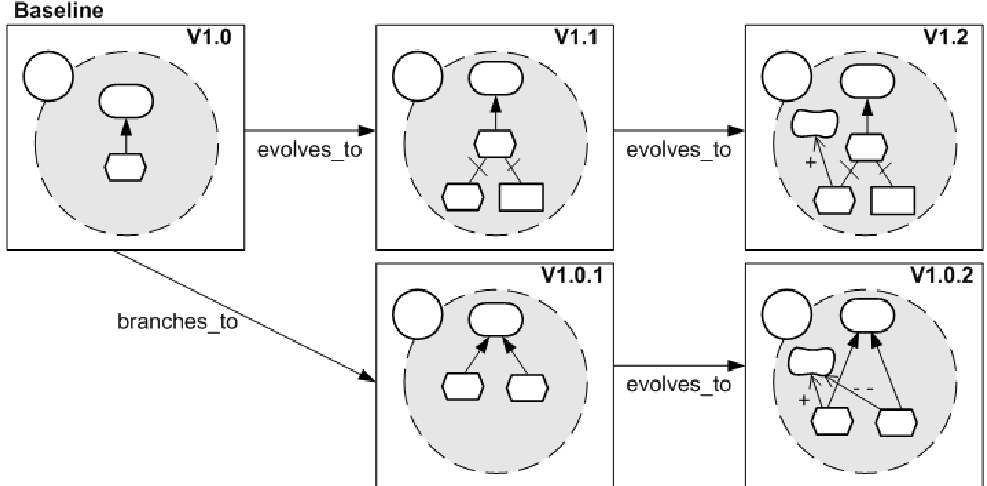 Figure 2: The branching and versioning logic in Layer A.
Critical Analysis & Conclusion
Takeaway: ITrace successfully elevates the software engineer from a mere "editor" to a "social actor." By documenting the Intent and the Environment of a change, it future-proofs the project against knowledge loss when team members leave.
Limitations: As the authors admit, the graph can become "cumbersome" as it grows. While it works for periodic "snapshots," full-scale continuous social tracing might lead to information overload.
The Road Ahead: The authors suggest that analyzing these graphs could uncover patterns in how software evolves. In an era where AI (like LLMs) begins to take over coding, understanding the human social intent behind requirements becomes the most valuable asset in the development lifecycle.