
Political Bias vs. Ground Reality: How Delhi’s Odd-Even Experiment Reveals the Filter Bubbles of Human Perception
On the Role of Political Affiliation in Human Perception The Case of Delhi OddEven Experiment
This paper investigates the impact of political affiliation on human perception during the "Odd-Even" urban experiment in Delhi, using Twitter data and urban sensors. It combines sentiment analysis and political leaning inference to assess how public discourse aligned with or diverged from the ground truth of environmental and traffic outcomes.
TL;DR
Does your political party tell you what you see, or do you believe your own eyes? This study analyzes the famous "Odd-Even" traffic experiment in Delhi to prove that while political affiliation heavily colors human perception, physical proximity and personal experience act as a powerful antidote to ideological bias.
Academic Context: This work sits at the intersection of Computational Social Science and Urban Planning, utilizing Big Data to solve the "perception vs. reality" gap in public policy.
Problem: The Polarized Lens of Urban Policy
In 2016, Delhi launched a radical experiment: private cars could only drive on alternate days based on their license plate numbers (Odd or Even). The goal? Fight lethal air pollution. However, the experiment became a political battlefield. The AAP (state government) championed it, while the BJP (national opposition) decried its inefficiency. For researchers, this created a perfect "living lab" to ask: Can data tell us if people are lying to themselves based on their politics?
Methodology: Fusing Sensors with Sentiments
The researchers didn't just look at tweets; they established a "Ground Truth" to see who was actually right.
- Ground Truth: Data from Air Quality Monitoring Stations and Google Traffic API.
- Political Mapping: Identifying 64,000 users' leanings by analyzing who they follow. The "Direct Friendship" method (following specific party leaders) proved 95% accurate.
- Sentiment Analysis: Using SentiStrength and LabMT to quantify the "happiness" or "negativity" of discourse across three phases: Anticipation, Experience, and Recollection.
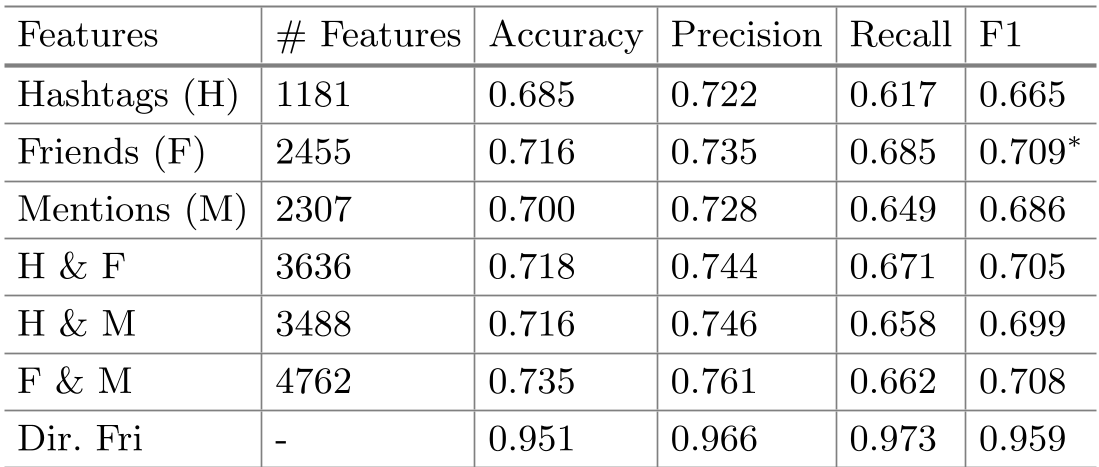 The study found that "who you follow" is a far more accurate predictor of politics than "what you say" (hashtags).
Key Insights: Reality vs. Rhetoric
1. The Hallucination of Success
The ground truth was clear: Traffic improved (average speed +18%), but Air Quality did not. Despite this, AAP supporters remained highly enthusiastic about air quality improvements. They "perceived" cleaner air because their party told them it was working, even though sensors proved otherwise. BJP supporters remained skeptical of everything, including the very real traffic improvements.
2. The "Delhi Effect": Experience as a De-biasing Tool
The most profound discovery occurred when the researchers filtered users by Location.
- Outside Delhi: Supporters of both parties were extremely polarized, essentially acting as "echo chambers" for party lines.
- Inside Delhi: The gap narrowed. When BJP supporters actually had to drive on clearer roads, their sentiment scores rose. When AAP supporters actually breathed the same smog, their "forced positivity" softened.
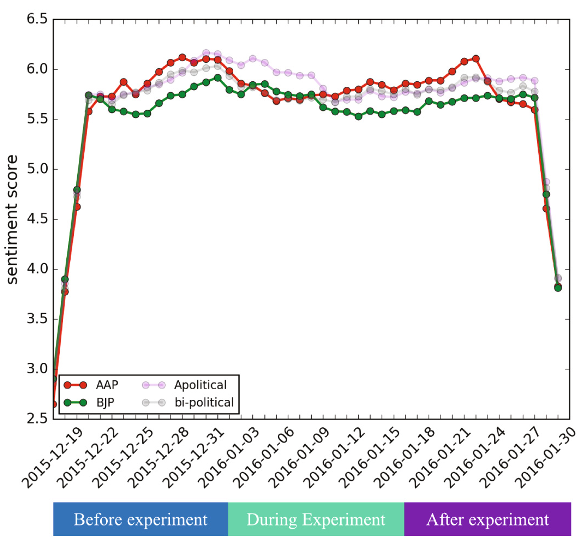 Note the convergence in chart (b) representing users physically present in Delhi, compared to the wider gap in the global population.
Critical Analysis & Conclusion
This paper provides a sobering look at the "Social Media Echo Chamber." It demonstrates that Political Affiliation is a massive confounder in human perception of reality.
Takeaway for Policy Makers: If you want to know if a policy is working, don't just "listen to the internet." The internet is a noise machine of ideological posturing. Instead, focus on the localized discourse of those physically impacted by the change. Personal experience is one of the few things capable of breaking the spell of political bias.
Limitations: The study relies on Twitter (now X) data, which is known for its demographic bias (younger, more tech-savvy). Additionally, the use of automated sentiment analysis can sometimes struggle with the heavy sarcasm often found in Indian political discourse.