
Deciphering Rural Prosperity: How Electricity Big Data Outperforms AI in Economic Forecasting
Research on Relationship Between Rural Residents' Income and Electricity Consumption Features
This paper utilizes industrial electricity big data to model and predict the per capita net income of rural residents in China. By applying a Panel Data Model to datasets from 151 counties across 6 provinces, it establishes significant correlations between specific electricity consumption features (agricultural, industrial, and residential) and economic well-being.
TL;DR
Is it possible to predict rural poverty levels in real-time without waiting for delayed government surveys? Researchers from the China University of Political Science and Law have demonstrated that electricity consumption patterns—broken down by sector—provide a high-fidelity mirror of rural income. Their study reveals that while classic machine learning often fails in small-sample macroeconomic contexts, a robust Panel Data Model can achieve an 85% accuracy rate by leveraging time-series trends and sectoral shifts.
Background: The Latency of Statistics
In the quest for "Precise Poverty Alleviation," the biggest hurdle isn't just lack of resources, but lack of timely data. Traditional economic surveys are often plagued by:
- Time Lags: Data moves through layers of bureaucracy before being published.
- Subjectivity: Manual reporting can lead to inaccuracies.
By using electricity data (Big Data from the State Grid), we gain access to a "live pulse" of the economy—objective, automated, and high-frequency.
The Core Insight: Industry vs. Agriculture
The paper uncovers a fascinating paradox in China's current rural landscape. While we traditionally associate "Industrialization" with wealth, the study found a negative correlation between industrial electricity growth and rural residents' net income in several poor provinces.
Why? The authors suggest this reflects China's supply-side reform. Backward, heavy-polluting industrial growth often doesn't trickle down to rural residents as effectively as modern agricultural development or the growth of the service (commercial) sector.
Methodology: Why Panel Data Beats Machine Learning
The team compared their Panel Data Analysis against popular ML algorithms (BP Neural Networks, SVM, Regression Trees).
1. The Architecture of the Model
The authors integrated both cross-sectional (different counties) and time-series (2008-2018) data.
- Independent Variables: Ratios of industrial, agricultural, and commercial electricity consumption, plus residential usage per household.
- Control Factors: Time trends and provincial differences.
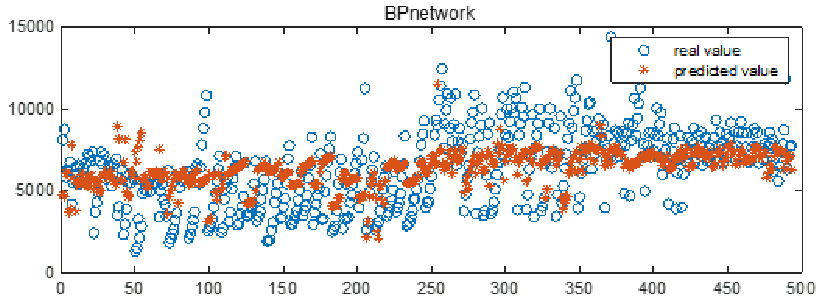 Figure 1: The Panel Model shows high consistency between predicted (Red) and actual (Blue) income values, maintaining stability across different years.
2. The Overfitting Trap of ML
ML models like Generalized Regression Neural Networks (GRNN) showed 100% accuracy on training data but failed miserably on test data (R2 < 0.1). This highlights the "Small Sample Problem" in macroeconomics: when data is scarce (658 samples), deep learning "memorizes" noise rather than learning economic leyes. The Panel Model wins because it embeds economic intuition (time trends) into its structure.
Quantitative Results
The final optimized regression equation provides a clear roadmap for policy:
- Residential Power (+): Higher household electricity use directly correlates with improved living standards.
- Agricultural Proportion (+): Modernizing agriculture remains the backbone of rural wealth.
- Industrial Growth Rate (-): Rapid industrial expansion in these regions often signals "backward" capacity that doesn't benefit local farmers.
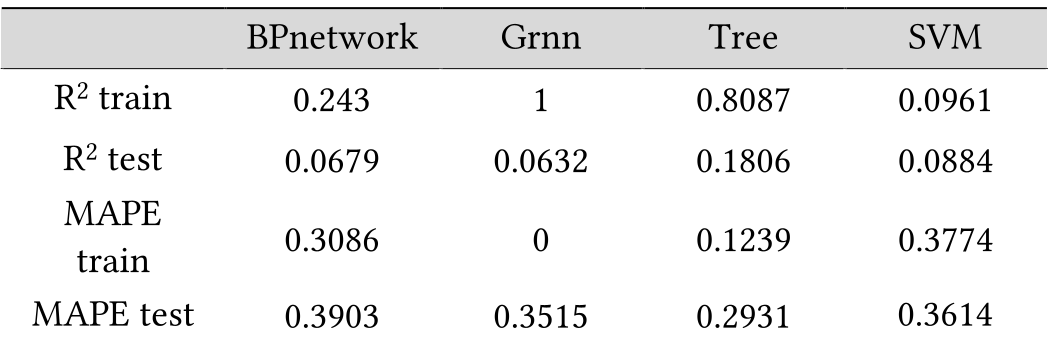 Table 1: Comparative performance metrics—Note the extreme overfitting of Grnn and Tree models.
Real-World Application: Luanchuan County
The study concludes by predicting 2018 income for Luanchuan County. By observing a "plump" (sharp decrease) in industrial growth and an increase in residential use, the model predicted a significant jump in net income, outperforming simple linear growth projections.
Critical Insight & Conclusion
This research underscores a vital lesson for AI practitioners: Big Data doesn't always require "Big Models." In fields like macroeconomics where the underlying physics (economic laws) are relatively stable but the data volume is limited, traditional econometric tools like Panel Data Models offer better interpretability and generalization than neural networks.
For future policy, the message is clear: to boost rural income, focus on tertiary industry construction and household quality of life rather than simply building more factories.