
Crisis-Aware Forecasting: Leveraging Economic Indicators to Survive Global Shocks
Sales Forecasting Under Economic Crisis: A Case Study of the Impact of the COVID19 Crisis to the Predictability of Sales of a Medium-Sized Enterprise
This paper presents a B2B retail case study on sales forecasting using a Histogram-based Gradient Boosting Regression Tree (HGBRT/LightGBM). By integrating external economic indicators, the study demonstrates how to maintain predictive accuracy during extreme global events like the COVID-19 pandemic.
TL;DR
Can machine learning predict how a pandemic will hit a medium-sized business? This case study investigates a B2B industrial dealer in Germany, demonstrating that by integrating OECD Business Confidence Indicators and Stock Market Indices into a LightGBM model, forecasting accuracy during the COVID-19 crisis improved by 4.4%. The secret sauce? Training the model on historical crises (like 2008) to teach it how to react to external shocks.
The Motivation: When History Doesn't Repeat ITSELF (Exactly)
Most enterprises treat sales forecasting as an internal game—looking at last year's spreadsheets to predict next month's shipments. This works in a vacuum but fails spectacularly during global events. The authors identify a critical gap: SMEs often lack the technical framework to incorporate "Global External Shocks" into their pipelines.
The core insight here is that while the cause of a crisis (a virus vs. a mortgage collapse) differs, the economic leading indicators—business confidence and market sentiment—often exhibit similar predictive patterns that a machine learning model can exploit.
Methodology: Teaching Machines the "Language of Crisis"
The researchers employed a Histogram-based Gradient Boosting Regression Tree (HGBRT), effectively the Scikit-learn implementation of LightGBM. This choice reflects modern SOTA preferences for tabular data, outperforming traditional ARIMA or simple Linear Regression in handling non-linear relationships.
The Feature Set
Beyond typical IDs and time-stamping, the model was fed:
- OECD Business Confidence Indicator (BCI): Spanning China, Germany, and the US.
- Major Stock Indices: SSE, DJI, and DAX.
- Crisis Memory: Specifically including or excluding the 2008-2011 period to test the importance of historical "adversarial" training.
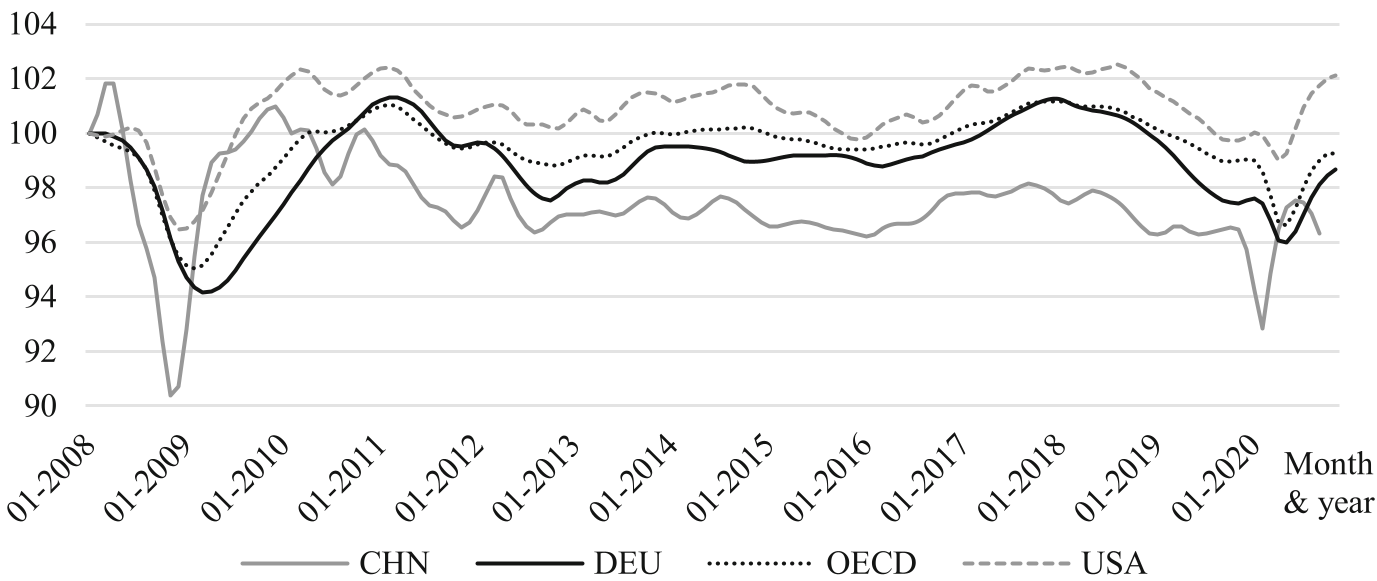 Figure: The synchronization of global Business Confidence Indicators during the 2009 and 2020 crises.
Experiments & Results
The authors designed 8 experiments to decouple the impact of indicators from the impact of the training period.
Key Findings:
- Macro Matters: Adding BCI alone improved the MAD-by-mean-ratio (error metric) by 3.3%. Adding both BCI and Stock Market data boosted this to 4.4%.
- Crisis-Pruning is Dangerous: Models that skipped the 2008 financial crisis in their training data performed significantly worse during the 2020 COVID-19 shock. The model needs to see a "collapse" to understand how to interpret a plummeting BCI.
- The Randomness Factor: Using 1,000 random states for cross-validation, the authors proved that these improvements weren't just "lucky seeds" but statistically significant shifts in predictive power.
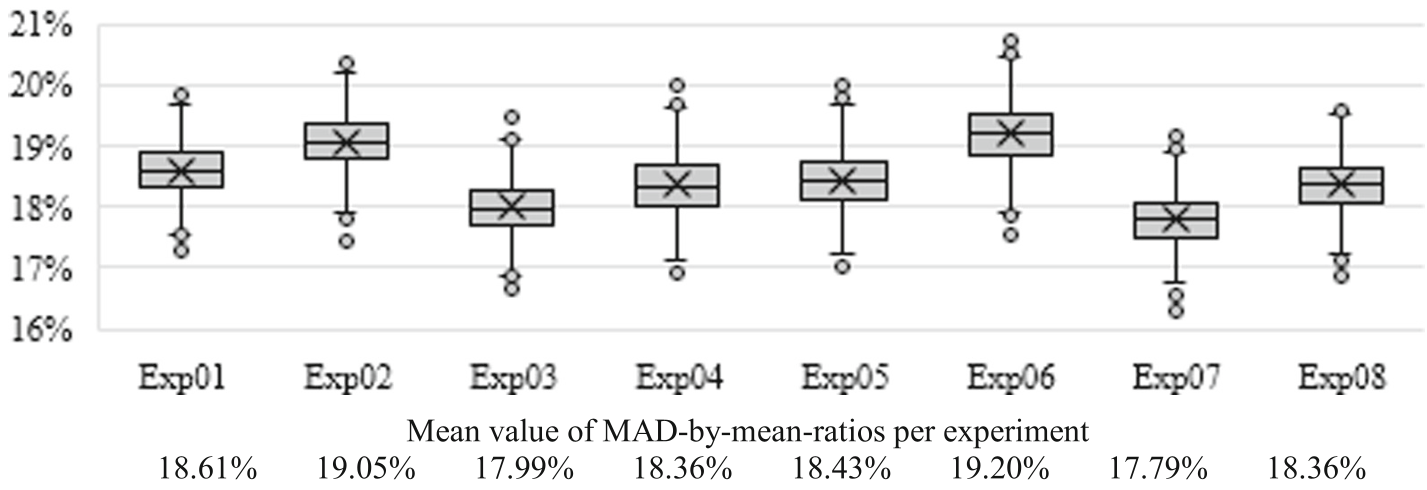 Figure: Distribution of error rates across 8 experiments. Exp07 (All indicators + full history) consistently outperforms the baseline.
Critical Analysis & Conclusion
The Takeaway
This study proves that even for non-international SMEs, global economic sentiment is a vital feature. The Inductive Bias of GBDT models allows them to pick up these signals effectively without the massive data requirements of Deep Learning.
Limitations & Future Work
- Lag Time: The study uses "three-month ahead" forecasting. In a fast-moving crisis, the delay in reporting macro indicators might reduce real-world utility.
- Instance Specificity: As a single enterprise case study, the specific weights (e.g., the high correlation with German BCI) might not translate directly to consumer electronics or fashion retail.
- Call to Action: Future research should look at "Nowcasting" indicators—alternative data like shipping container throughput or satellite imagery—to provide even faster reaction times for B2B models.
Final Verdict: A pragmatic, rigorously validated roadmap for how mid-sized businesses can move from "reactive" to "predictive" even when the world is in chaos.