
Stabilizing the Chaos: Visualizing Social Network Evolution via Modified Sammon's Projection
Visualization of social network dynamics using Sammon's projection
This paper introduces a specialized visualization framework for social network dynamics by modifying Sammon's Projection. By combining an "anchor layout" initialization strategy with linear interpolation, the method achieves stable and smooth transitions in 3D co-authorship networks extracted from the DBLP database.
TL;DR
Understanding how social communities evolve is difficult because visualization algorithms typically "reset" between snapshots, causing disorienting jumps. This paper presents a method to stabilize these dynamics using Sammon's Projection combined with a "Future-to-Past" anchoring strategy and linear interpolation, allowing for a smooth 3D view of academic collaboration history.
Background & Motivation: The Problem of "Layout Jitter"
In social network analysis, we don't just care about who is connected today; we care about how those connections formed. However, mapping a high-dimensional network (where each author might have hundreds of potential links) into a 2D or 3D space is mathematically volatile.
Standard algorithms like Force-Directed Placement or Sammon’s Projection use random initialization. If you run them on January's data and then February's data, even if only one link changed, the entire map might rotate, flip, or explode. This prevents the human eye from following a specific node’s "trajectory" through time.
Methodology: The Stabilization Trifecta
The authors propose a unique workflow to force temporal consistency onto Sammon's Projection.
1. The "Anchor Layout" Concept
Rather than starting from a random distribution for every month, the authors look at the final state of the network (the "Anchor"). They compute this layout first. Then, they use these final positions as the starting coordinates for the previous month. By working backward (or using a fixed reference), they ensure that nodes "want" to stay near their long-term average positions.
2. Modified Sammon's Update
Sammon's Projection minimizes a "Stress" function (the difference between high-dimensional distances and low-dimensional distances). The paper introduces a dynamic updating coefficient : This exponential decay allows the algorithm to settle into a stable configuration more effectively than the standard fixed-step methods.
3. Linear Interpolation for Community Transitions
When a community splits or merges, the jump can still be large. The authors use parametric equations to generate "intermediate" frames between months, specifically for nodes moving beyond a certain threshold.
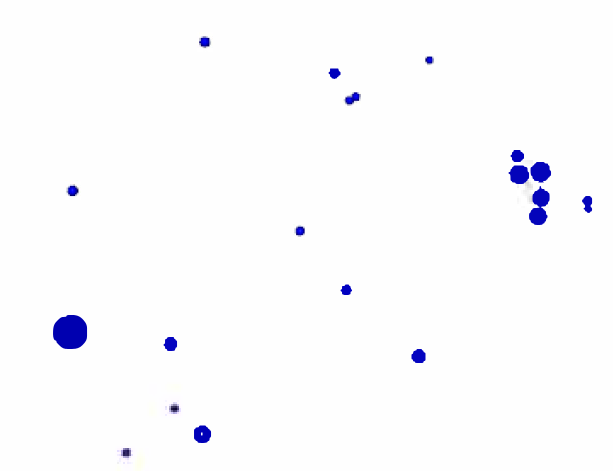 Fig 1: Standard Sammon's Projection results in chaotic, non-observable changes between periods.
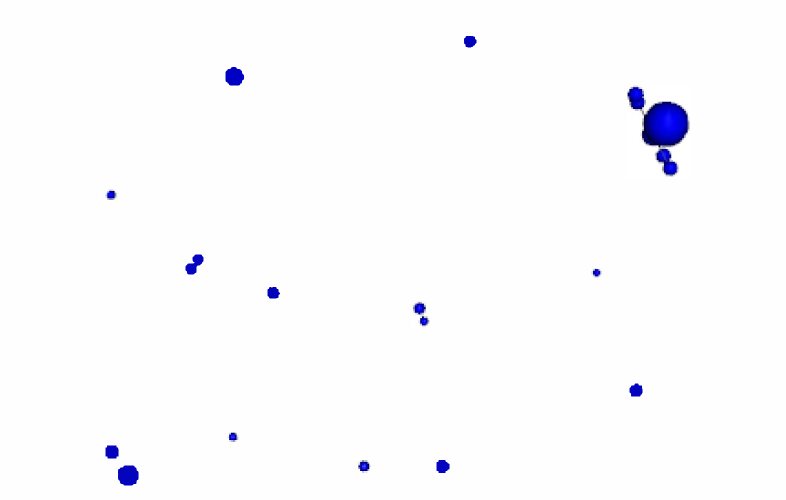 Fig 4: With the Anchor Layout and modified initialization, the evolution becomes smooth and traceable.
Experimental Insights: DBLP Co-authorship
The authors tested this on a 120-month dataset centered around the co-authors of Václav Snášel.
- Data Scale: 264,130 vertices and 662,536 edges in total.
- Visual Cues: Node size reflects vertex weight (calculated via a forgetting function—the more you publish, the bigger you stay), and edges represent community membership.
- The Result: By interpolating between snapshots (as seen in the transition from Fig 7 to Fig 14), they could visibly track a new research community forming in the 3D space.
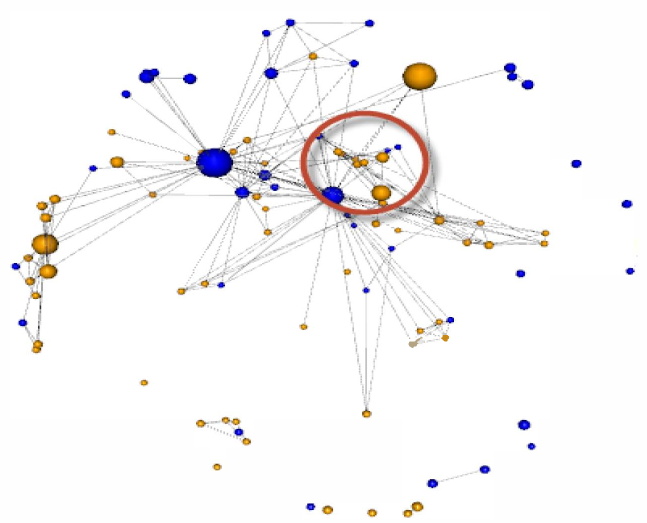 Fig 11: One of the interpolated frames showing a community in flux, allowing the user to "feel" the movement of the network.
Critical Analysis & Conclusion
The brilliance of this work lies in its simplicity. Instead of inventing a new, complex mathematical manifold, it addresses the UI/UX of network science. By anchoring the visualization to a known state and decaying the learning rate, it transforms a series of static images into a coherent narrative.
Limitations:
- Scalability: Sammon’s Projection requires a distance matrix between all points, making it in complexity. This won't scale to millions of nodes without significant approximation (e.g., using Landmark Sammon's).
- Future-Bias: Using the last state as an anchor works for historical analysis but cannot be used for real-time streaming data where the future is unknown.
Takeaway: For any tech leader or researcher building observability tools, this paper proves that initialization is everything when dealing with dynamic data. If you want your users to understand change, you must first give them a stable ground to stand on.