
SAR Sensors and Machine Learning: Tracking Environmental Evolution via Remote Sensing
SAR sensors measurements for environmental classification: Machine learning-based performances
This paper presents a Machine Learning-Based framework for environmental classification using Synthetic Aperture Radar (SAR) sensor measurements. By implementing a deep learning algorithm and OpenCV-based template matching, the study successfully monitors land-use changes—specifically forest expansion (+5.3 ha)—in Italy's Basilicata region between 1992 and 1996.
TL;DR
This research explores the synergy between Synthetic Aperture Radar (SAR) measurements and Machine Learning to classify sensitive environmental regions. By analyzing satellite data from 1992 and 1996 in Southern Italy, the authors demonstrate how deep learning-driven image processing can precisely track the expansion of forest habitats against receding grasslands, validated through spectral density comparisons.
Background & Motivation: The Challenge of the "Unseen"
Environmental monitoring is critical for protecting biodiversity, yet the sensors we use—like SAR—produce complex, noisy data. The Instantaneous Field of View (IFOV) and the Point Spread Function (PSF) of these sensors often introduce distortions and noise that make traditional visual interpretation unreliable. The authors' motivation stems from the need to move beyond simple "photo interpretation" towards an automated, high-precision Machine Learning framework that can distinguish between the spectral signatures of materials like trees, grass, and bare soil.
Methodology: Deep Learning Meets Spectral Analysis
The core of the study relies on a multi-stage processing pipeline implemented in a Python environment using OpenCV.
1. Feature Extraction and Template Matching
The algorithm employs a template matching approach to align and compare SAR images across different time periods. It uses a distance-based relationship to calculate the probability of specific land features appearing in the target area.
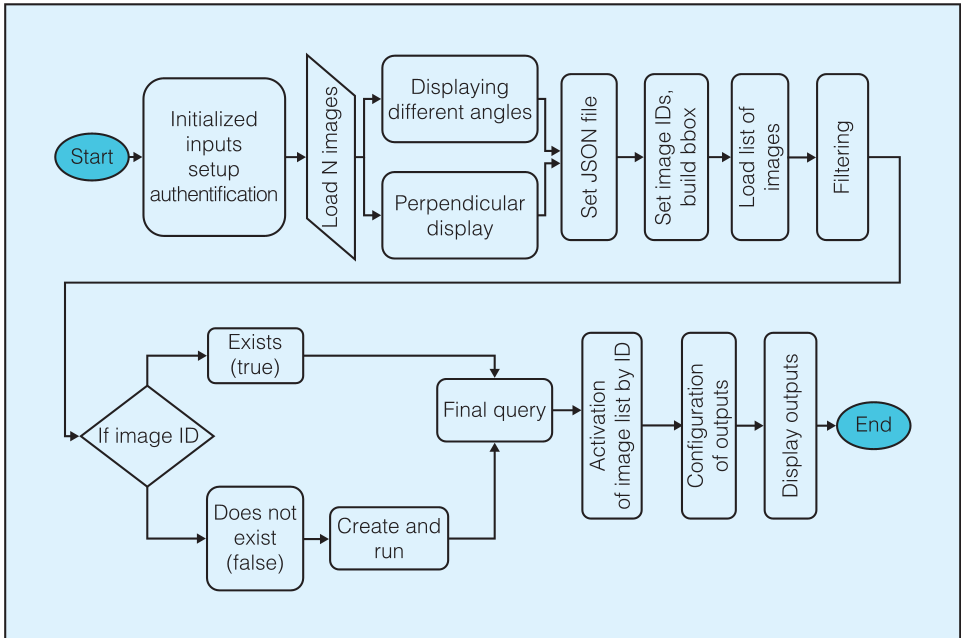 Fig. 5: The proposed OpenCV-based algorithm for processing and matching features within SAR images.
2. Histogram Back-projection
By converting images to HSV (Hue, Saturation, and Value) format and calculating 1-D histograms, the system identifies the "tone index" of pixels. Darker tones in the L-band typically indicate higher reflectance from dense vegetation, while variations in pixel intensity help differentiate between "transitional woodlands" and "bare soil."
3. Verification through Convolution and PSD
To ensure the ML results weren't just artifacts of sensor noise, the researchers applied a Power Spectral Density (PSD) analysis. They implemented a Gaussian kernel convolution to smooth the images, finding that the 1996 images had much smoother spectral side-lobes—a clear physical indicator of uniform green coverage compared to the high-reflectance "spiky" signature of rocky terrain found in 1992.
Experimental Results: A Greener Basilicata
The study focused on a 112-hectare area in the Basilicata region of Italy. The comparison between April 1992 and June 1996 revealed a clear ecological shift:
- Forest Expansion: Forest area increased from 72.10 ha (64.35%) to 77.40 ha (69.08%).
- Grassland Reduction: A net loss of 2.7 ha was observed as vegetation matured into transitional woodlands and forests.
- Performance Metrics: The classification was validated using a Confusion Matrix, achieving high precision and recall, ensuring that the "Net Change" reported was statistically significant.
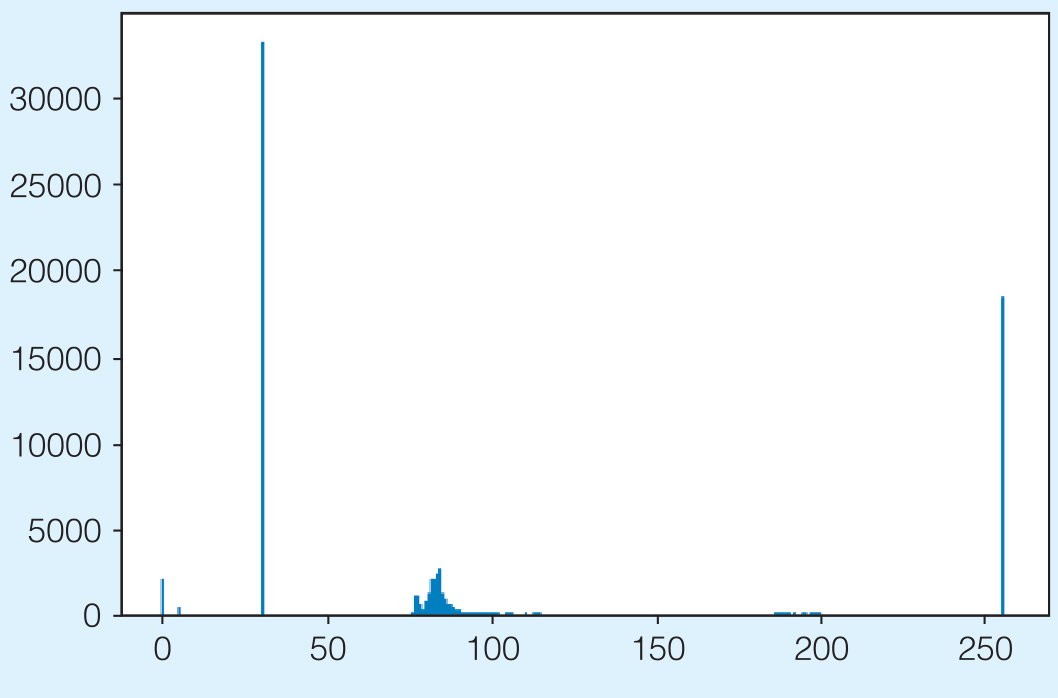 Fig. 6: 1992 vs 1996 comparison highlighting the shift in pixel grey levels—the peak shift toward 250 in the L-band indicates increased forest density.
Deep Insights & Future Outlook
The true value of this work lies in its hybrid approach. By using Machine Learning to handle the "big data" aspect of pixel classification and classical signal processing (Convolution/Kernels) to validate the "physics" of the reflectance, the authors provide a template for reliable environmental auditing.
However, a noted limitation is the qualitative nature of some L-band inferences; while we can see the increase in forest, the specific biomass volume remains difficult to calculate solely from grey-scale SAR without multi-band fusion. Future work in this space will likely integrate these ML models with GIS-based temporal predictive modeling to help park rangers and environmentalists forecast desertification risks before they become irreversible.
Takeaway: The marriage of SAR sensors and Deep Learning is turning satellite imagery from "static pictures" into "dynamic biological sensors," allowing us to monitor the pulse of the planet's green lungs with unprecedented accuracy.