
Visual Storytelling: Scaffolding Communities of Practice through Network Reflexivity
Scaffolding Educational Community of Practice Using Visual Storytelling
This paper introduces a method for scaffolding educational communities of practice by integrating "visual storytelling" with Social Network Analysis (SNA). It demonstrates a transition from isolated socio-educational projects to a large-scale collaborative platform, edu.crowdexpert.ru, achieving participation from over 90,000 educators.
TL;DR
This research addresses the challenge of scaling individual social projects into sustainable Communities of Practice. By leveraging Social Network Analysis (SNA) and Visual Storytelling, the authors provide participants with "sociograms" that map their interactions. This transparency fosters Social Reflexivity, allowing a massive network of 90,000+ teachers to understand and optimize their collaborative dynamics in e-governance and educational tasks.
Background: From Crowds to Communities
The early 21st century marked a shift from a culture of observation to a culture of direct participation. However, simply providing a platform for "crowdwriting" does not guarantee a functional community. Projects often fail because the social structure—who talks to whom, who edits what—remains invisible.
The authors argue that for e-governance and education to succeed, participants must move beyond just "voting" or "commenting" and engage in social reflection. They propose that if participants can see the network they are building, they can improve how they collaborate.
Methodology: Object-Oriented Sociality
The core of the methodology lies in the concept of Object-Oriented Sociality. In this framework, social networks are not just collections of people, but networks built around "social objects" (e.g., a legislative draft, a lesson plan, or a story).
1. The Bipartite Graph of Collaboration
Every action on the platform edu.crowdexpert.ru is recorded as a triplet: Agent ID | Object ID | Action Type. This allows the researchers to model the community as a bipartite graph where agents are linked via shared digital artifacts.
2. Tools for Visualization
The authors utilize two primary technical stacks:
- iGraph (R): Used for calculating static metrics like density, centrality, and clustering coefficients to assess the "health" of a project.
- NetLogo: Used to create Dynamic Wikigrams, multi-agent models that show the evolution of collaboration over time.
 Note: The platform decomposes complex documents (like laws) into segments that can be independently modified and voted upon.
Experiments & Results
The system was tested on massive socio-educational projects, including legislative proposals in Russia. By analyzing the log files, the authors could distinguish between "high-level" and "low-level" collaboration based on sociogram patterns.
Evaluation Criteria for Sociograms
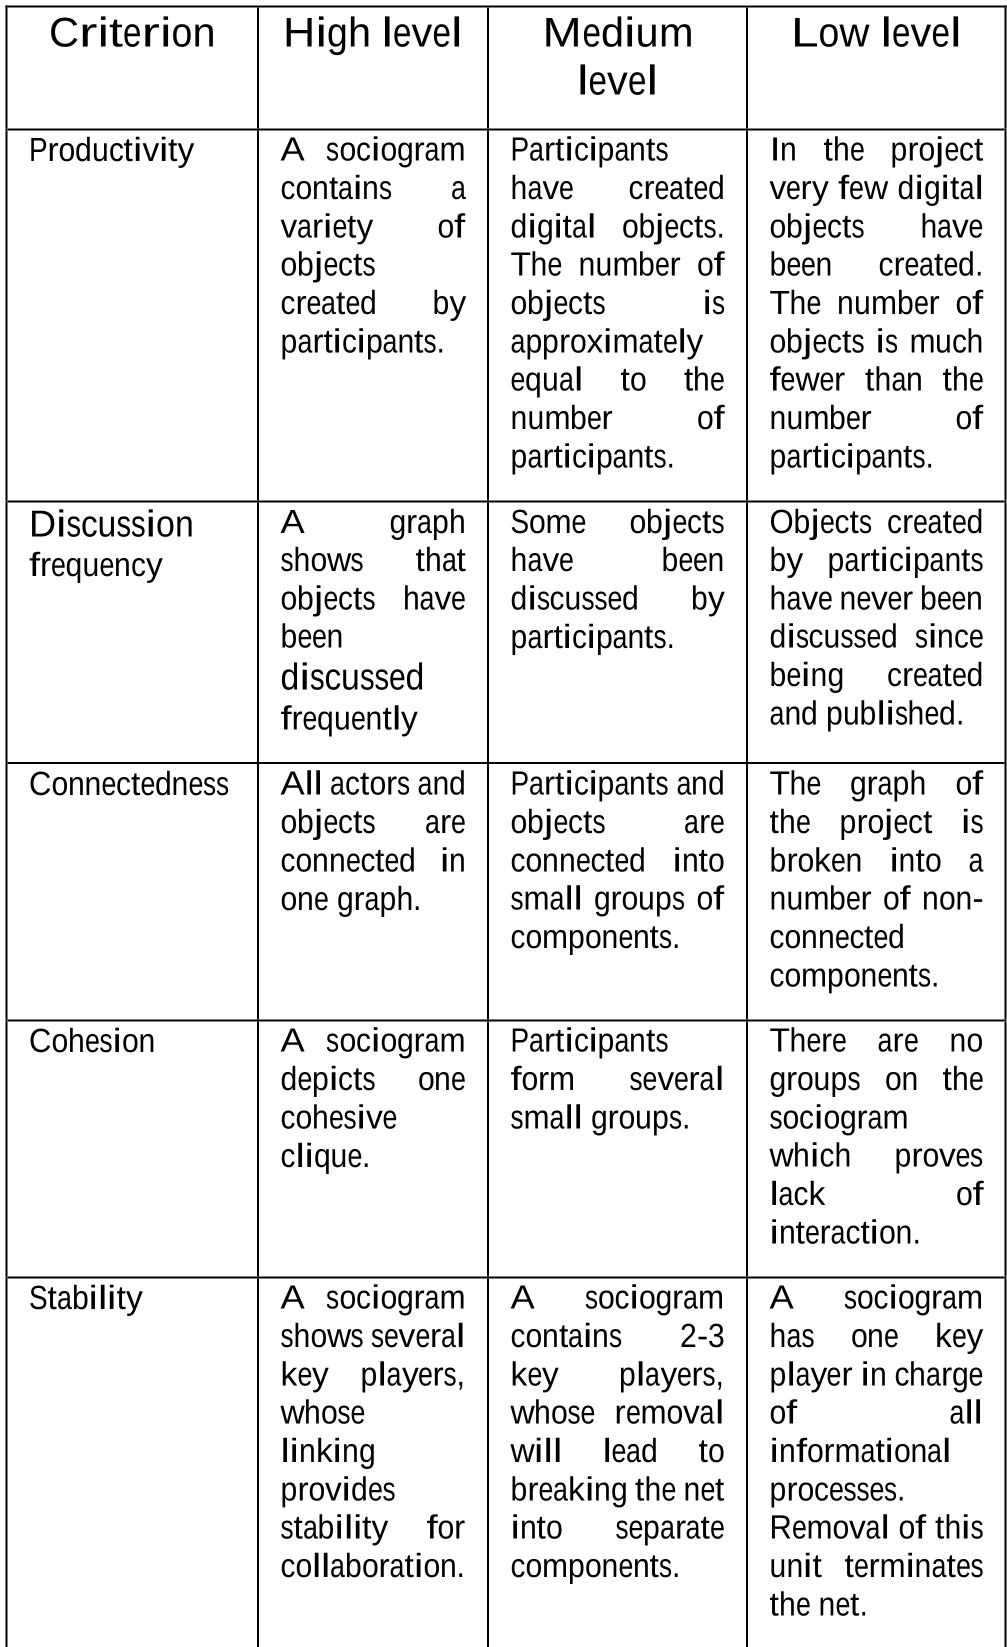
The authors developed a rubric to help community managers and teachers evaluate their social structure:
| Criterion | High Level | Low Level |
|---|---|---|
| Connectedness | All actors and objects in one cohesive graph. | Broken into many non-connected components. |
| Cohesion | Depicts a cohesive clique. | No discernible groups, lack of interaction. |
| Stability | Multiple key players; network survives individual departures. | Single key player (bottleneck); removal kills the network. |
Deep Insights: Triggering Social Reflexivity
The most striking finding is the role of Visual Storytelling. Instead of sending raw statistics (which can be intimidating), the authors sent weekly newsletters featuring sociograms.
Why this works:
- Task vs. Social Reflexivity: While most platforms focus on task outcomes (the document), sociograms trigger social reflexivity—the ability of a group to reflect on its own internal processes.
- Reduced Complexity: By visualizing thousands of interactions as a single map, the "information noise" is reduced into a recognizable pattern.
Conclusion & Future Outlook
The paper proves that Learning Analytics is not just for researchers—it is a scaffolding tool for the participants themselves. By making the "Invisible College" visible, communities can self-organize more effectively.
Limitations: The study notes that while visualizations trigger discussion, they don't always lead to immediate behavioral changes. Future research should explore how to integrate these visual cues directly into the UI/UX of collaborative editors to provide real-time feedback loops.
Takeaway for Practitioners: If you are building a collaborative platform, don't just show a "leaderboard" of points. Show a "map" of relationships. The value of a community is not just what it produces, but how it is connected.