
Scalable Similarity Estimation: How ADS and REL Revolutionize Social Graph Mining
Scalable similarity estimation in social networks: closeness, node labels, and random edge lengths
This paper introduces a scalable framework for similarity estimation in massive social networks by combining All-Distances Sketches (ADS) with a novel "Closeness Similarity" measure and Randomized Edge Lengths (REL). The proposed methods achieve microsecond-level query times on networks with tens of millions of nodes and hundreds of millions of edges, maintaining competitive accuracy against global baselines like Random Walk with Restart (RWR).
TL;DR
Researchers from Microsoft have pioneered a way to perform global similarity queries on social networks with over 600 million edges in just microseconds. By pre-building All-Distances Sketches (ADS) and introducing Randomized Edge Lengths (REL), they bridge the gap between fast local measures (which are inaccurate) and slow global measures (which are unscalable).
Background: The Global vs. Local Dilemma
In the world of social network analysis, "similarity" is the engine behind friend recommendations, ad placement, and community discovery.
- Local Measures (like Adamic-Adar) only look at immediate shared neighbors. They are fast but "blind" to anyone more than two hops away.
- Global Measures (like Random Walk with Restart or Katz) look at the whole graph. They provide high-quality results but crawling the whole graph for every query is impossible at Twitter or Facebook scale.
The authors position their work as a Global-Scale/Individual-Time solution: you do some clever work upfront (preprocessing) so that each individual "how similar are User A and User B?" question can be answered instantly.
The Core Innovation: Closeness Similarity
Instead of asking "how far is A from B?", the authors ask: "How similar is the way A sees the world to the way B sees the world?"
They define Closeness Similarity by comparing the distance vectors from two nodes to all other nodes in the network. This is essentially a Jaccard-like index of the "neighborhood views." Typically, this would be a computational nightmare, but the papers' use of ADS labels makes it a simple intersection of two small sets.
Methodology: The Technical Trio
1. ADS (All-Distances Sketches)
ADS is a sketching technique where each node stores a "portrait" of its distances to a small, randomly sampled subset of other nodes.
- Insight: You don't need to know the distance to every node; you just need enough samples to statistically reconstruct the neighborhood distribution.
- Mathematical Proof: The authors show it matches the theoretical bounds of Thorup-Zwick distance oracles while being far more versatile.
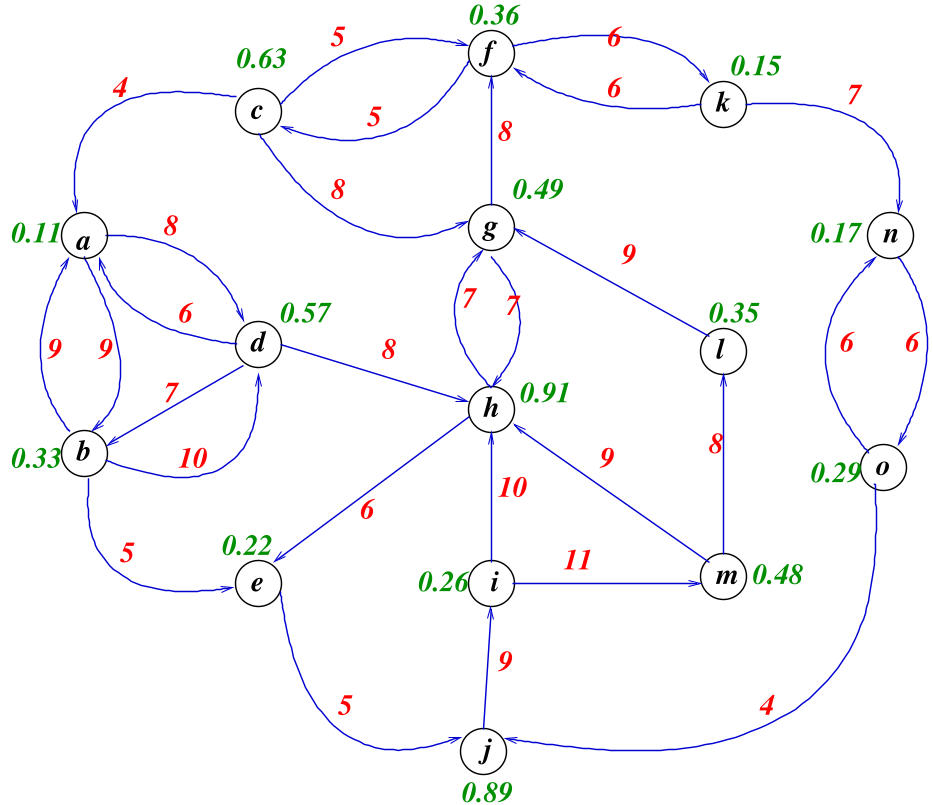 In the figure above, a directed network is sampled using random ranks to build these compact ADS labels.
2. REL (Randomized Edge Lengths)
Standard shortest paths forget one thing: Multiplicity. If there are 10 paths of length 3 between us, we are probably more similar than if there is only 1 path of length 3.
- By assigning edges a random length from an Exponential Distribution, the "expected" shortest path naturally favors pairs with multiple paths.
- Physical Intuition: Think of edges as fuses. The more parallel fuses you have, the more likely one is to burn through (finish the path) faster.
3. Combining for Scalability
By computing ADS labels after randomizing edge lengths, the system captures both distance and path multiplicity in a single static label.
Experimental Proof: Millions of Nodes, Microseconds of Time
The team tested this on the Twitter Mention Graph.
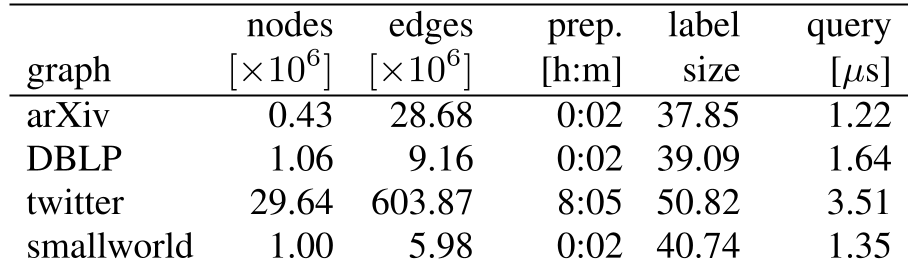 Key Takeaway: Preprocessing a 600M-edge graph takes ~8 hours, but query times drop to ~3.5 microseconds.
In the Spearman correlation tests against semantic "ground truth" (actual tweet content similarity), Closeness REL consistently outperformed local measures and shortest paths, specifically in the Twitter environment where the "mention frequency" (inverting weights) is noisy.
Critical Insight & Limitations
The beauty of this approach is its monotonicity. Unlike RWR, where a bad "restart probability" can ruin your results, increasing the sketch size () or the number of samples () in this method guarantees better accuracy. It is a predictable, tunable system.
Limitations: Preprocessing is still heavy. An 8-hour build time for Twitter is great for 2013, but in today's dynamic 2026 networks, we would need to investigate how to update these ADS labels incrementally as new edges form.
Conclusion
This paper serves as a masterclass in applying probabilistic sketching to graph theory. It proves that we don't have to choose between the speed of local heuristics and the intelligence of global algorithms—we can have both by sketching the "closeness" of the world.