
Beyond the Profile: How Discipline and Institution Shape Academic Social Networking
How does scholarly use of academic social networking sites differ by academic discipline? A case study using ResearchGate
This study investigates disciplinary differences in the use of ResearchGate (RG) among 77,902 scholars from 61 U.S. research universities. It categorizes users by Web of Science research areas and institutional research activity levels (R1, R2, R3) to establish a comprehensive baseline for scholarly behavior on Academic Social Networking Sites (ASNSs).
TL;DR
Is ResearchGate (RG) a level playing field for all scholars? A massive study of nearly 80,000 U.S. researchers reveals that your discipline and your university's research tier significantly dictate your "digital success." While biologists dominate the platform's population, social scientists garner the most attention per paper, and "R1" university affiliation remains a powerful catalyst for all metrics.
The "Invisible Hand" of Disciplinary Culture
For years, we’ve assumed that Academic Social Networking Sites (ASNSs) like ResearchGate function as democratic hubs for knowledge sharing. However, the study identifies a massive Inductive Bias in how these platforms are used. The core problem is that existing literature often ignores how institutional prestige (research activity level) interacts with the specialized information behaviors of different fields.
The researchers asked a critical question: Does a physicist at a small teaching college use ResearchGate the same way a biologist at Harvard does? The answer is a resounding "No," and the reasons are rooted in the physical and logic-driven intuitions of each field.
Methodology: Mapping the Digital Campus
The authors didn't just ask people how they use RG; they crawled the data. By targeting 61 U.S. universities across three Carnegie tiers (R1: Highest, R2: Higher, R3: Moderate), they captured a snapshot of real-world behavior.
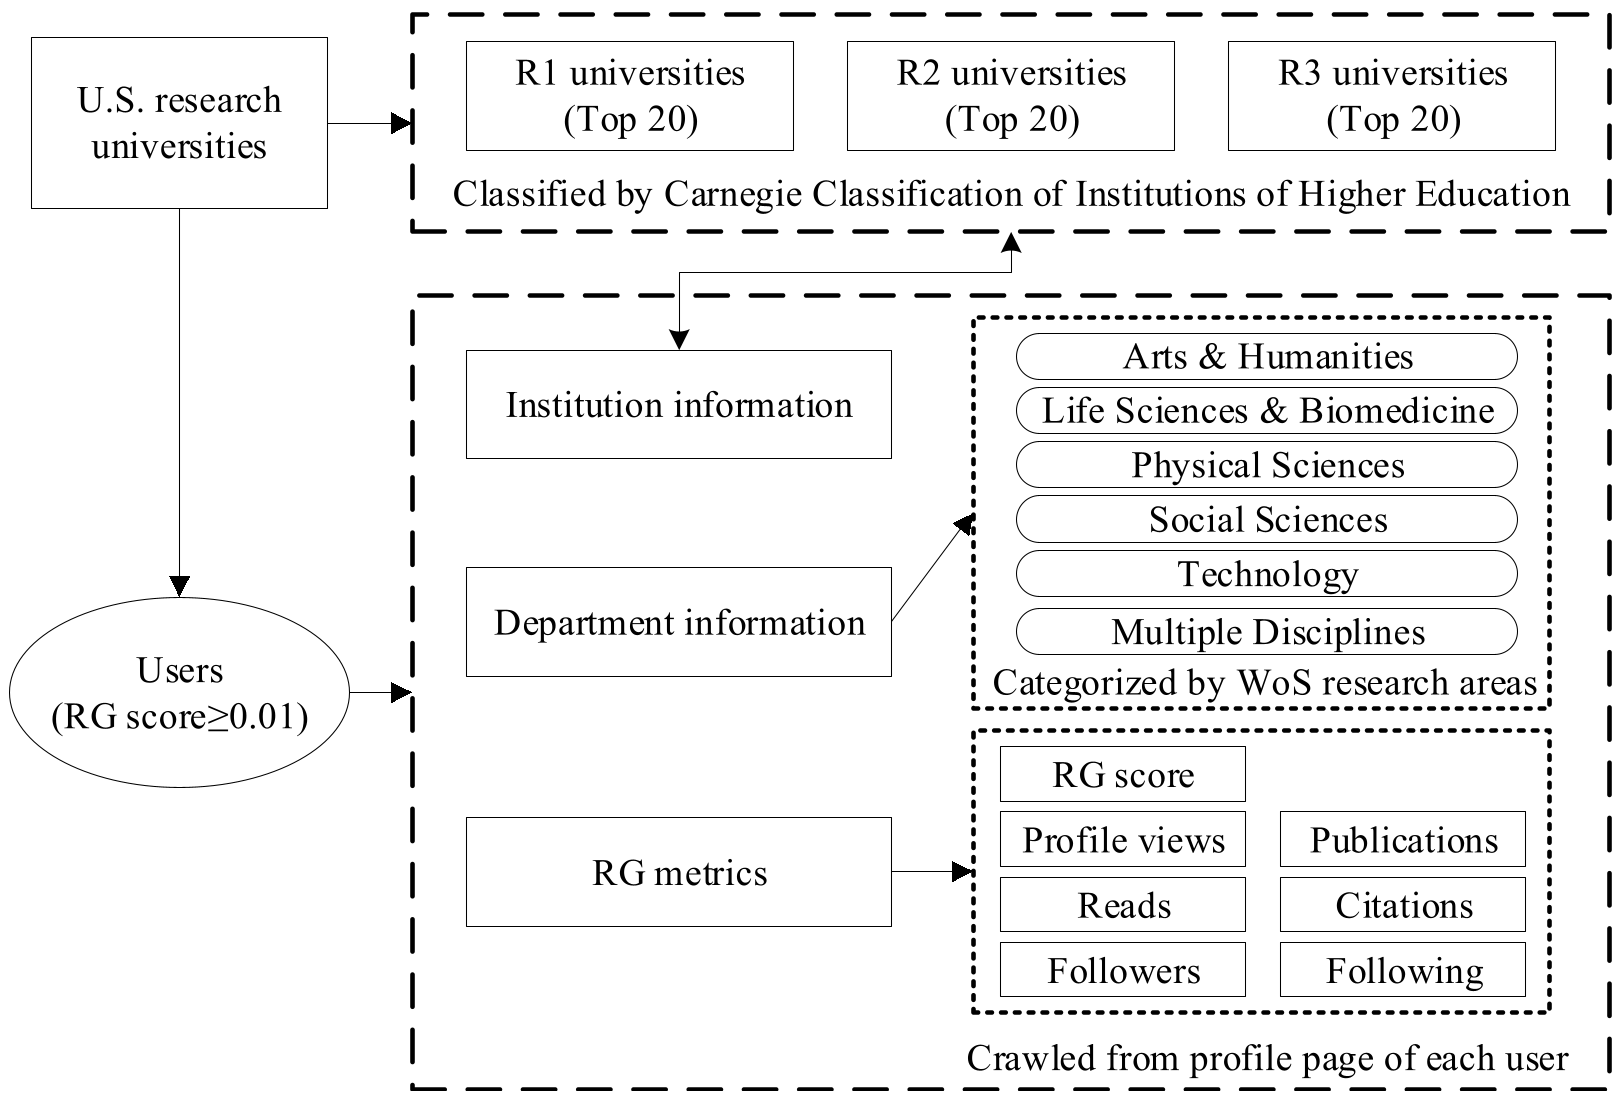
Users were categorized into:
- Life Sciences & Biomedicine (The Heavyweights)
- Physical Sciences (The Archivists)
- Social Sciences (The Networkers)
- Technology/Engineering (The Practitioners)
- Arts & Humanities (The Outsiders)
Core Insights: Who Wins the RG Game?
1. The Dominance of "Hard" Sciences
The Life Sciences and Biomedicine sectors account for over 50% of all users. These fields have higher "receptivity" to Open Access (OA) and use RG as a central nervous system for both sharing and following peers.
2. The Social Science Paradox
Interestingly, while Social Sciences scholars post fewer papers than Physical Sciences researchers, they receive the highest average reads per publication (50.64). Why? The researchers suggest that social science is often more "accessible" to a general audience and other disciplines, acting as a bridge in the scholarly ecosystem.

3. The Prestige Multiplier
The most striking finding is the role of the Institutional Research Activity Level. Across all disciplines, users from R1 universities outperformed those from R2 and R3 institutions in almost every metric. However, the study found that Social Sciences and Physical Sciences showed the most sensitivity to this institutional boost.
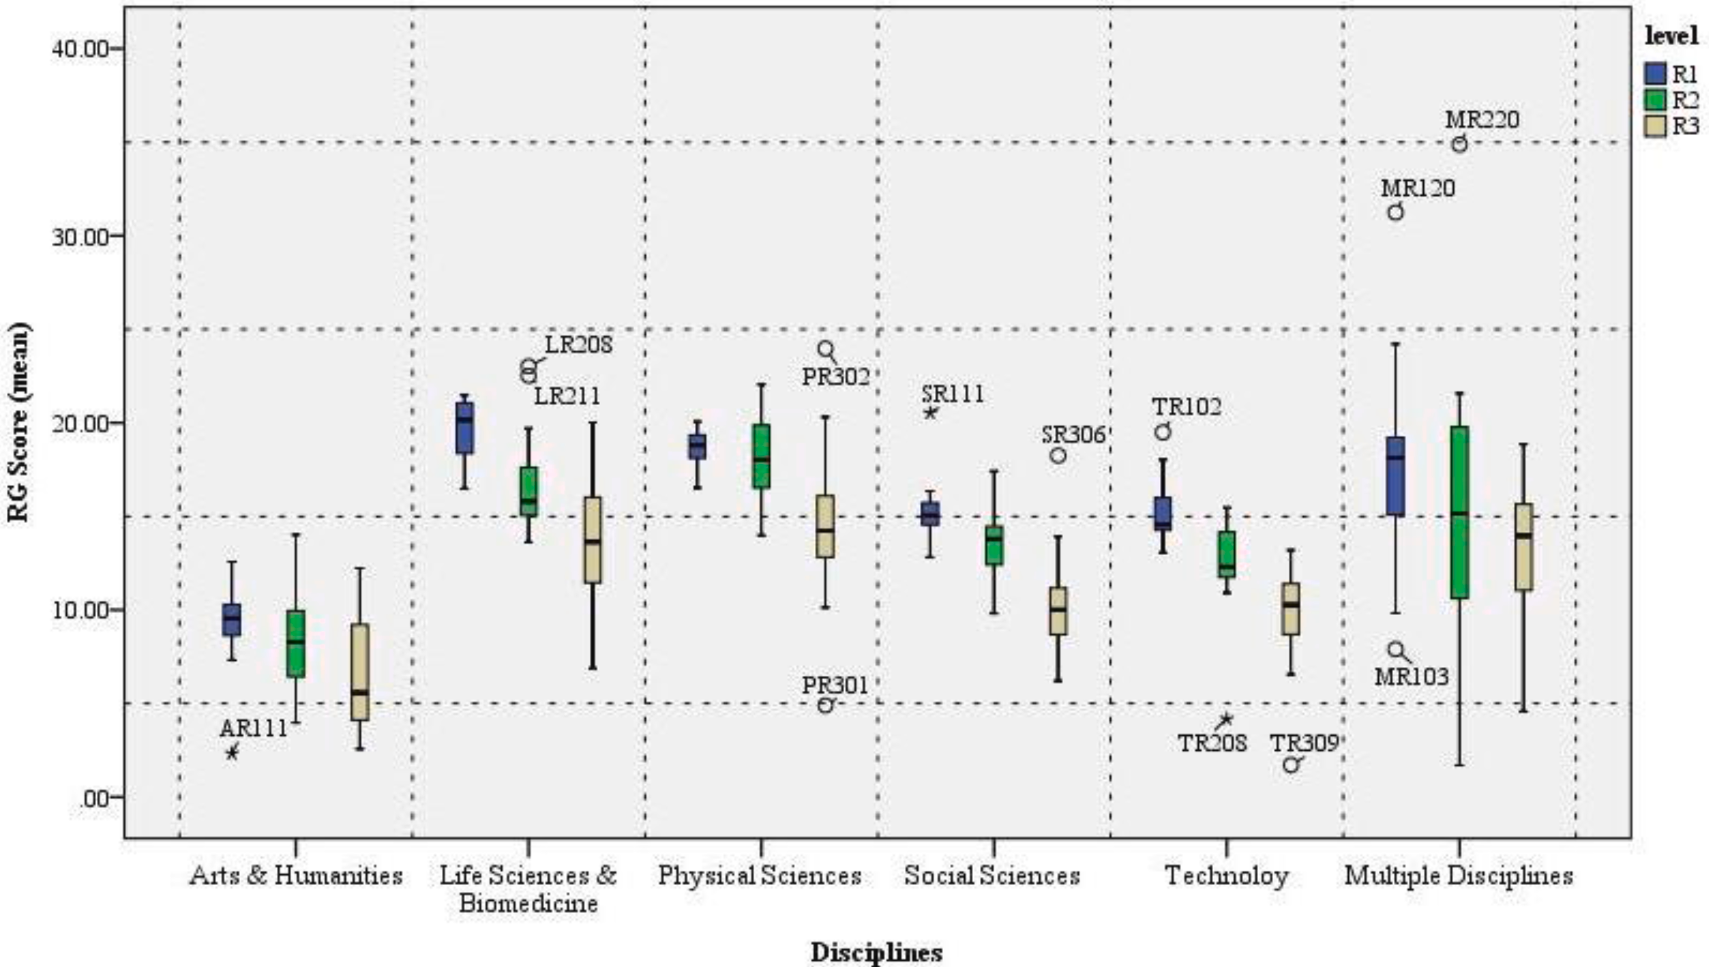 Figure: Note how R1 universities (higher research activity) show much tighter, higher clusters of RG scores compared to R2 and R3 tiers.
Critical Analysis: The Digital Divide
The study highlights a significant limitation for the Arts & Humanities. These scholars produce non-traditional outputs (media, performances, books) that RG's journal-centric algorithm fails to capture adequately. This leads to a persistent "ghost reputation" problem where their true impact is invisible in the digital metric space.
Takeaways for the Future
- For Universities: Don't use a single ASNS metric to evaluate faculty. An RG score of 15 means something entirely different in History than it does in Clinical Medicine.
- For Researchers: If you are in the Social Sciences, focus on the "networking" aspect—your work has high cross-disciplinary appeal. If in the Physical Sciences, maintain your "archival" habit, as frequency of updates correlates with profile views.
- For ASNS Platforms: There is an urgent need to make non-traditional research outputs (applied arts, software, datasets) "first-class citizens" in the scoring algorithm to ensure equitable representation across the academic spectrum.
Conclusion
This paper serves as a baseline for the evolving nature of scholarly communication. As we move toward a more "Altmetric-heavy" evaluation era, understanding the intersection of what you study and where you work is vital to navigating the academic social landscape.