
ScopeG: Bridging Social Media Analytics and Personality Comparison on Mobile
ScopeG: A Mobile Application for Exploration and Comparison of Personality Traits
The paper introduces ScopeG, a mobile application designed for the interactive exploration and comparison of personality traits (Big 5, Fundamental Needs, and Basic Human Values) derived from social media data. It features a novel hierarchical visualization called PersonalityGenome, utilizing specialized touch gestures to facilitate side-by-side and overlaid profile comparisons.
TL;DR
ScopeG is a specialized mobile application that transforms raw social media personality analytics into an interactive visual experience. By utilizing the PersonalityGenome—a hybrid hierarchical visualization—it allows users to explore their Big 5 traits and compare them against friends or celebrities using intuitive touch gestures. The system successfully addresses the human psychological drive for social comparison within a high-speed mobile context.
Problem & Motivation: The Gap in Self-Insight
Research has long proven that our digital footprints (social media posts) can accurately predict our "Big 5" personality traits, human values, and fundamental needs. However, this data remains largely inaccessible to the average user.
The authors identified two core challenges:
- Complexity of Hierarchy: Personality data isn't flat; it's a tree of traits and sub-traits. Visualizing this on a mobile screen without losing context is difficult.
- Social Comparison Drive: Humans have a natural tendency to evaluate themselves by looking at others—either "upward" (role models) or "downward" (to feel better about themselves). Prior to ScopeG, no mobile system integrated these social psychological needs with automated personality modeling.
Methodology: The PersonalityGenome
The researchers moved through an iterative design process, testing Sunburst, Bar, and Icicle charts. While Sunburst charts were "attractive," they were deemed too difficult for precise comparison. The resulting PersonalityGenome design prioritizes vertical stacking (like a bar chart) for readability while maintaining hierarchical nesting.
Key Features:
- Side-by-Side View: Optimized for comparing two distinct profiles across all categories.
- Overlaid View: A centered-bar approach that emphasizes the delta (difference) between the user and the comparison target.
- Gesture-Based Interaction: Instead of cluttered buttons, the system uses taps for folding/unfolding sub-traits, two-finger swipes for sorting, and pinches to toggle views.
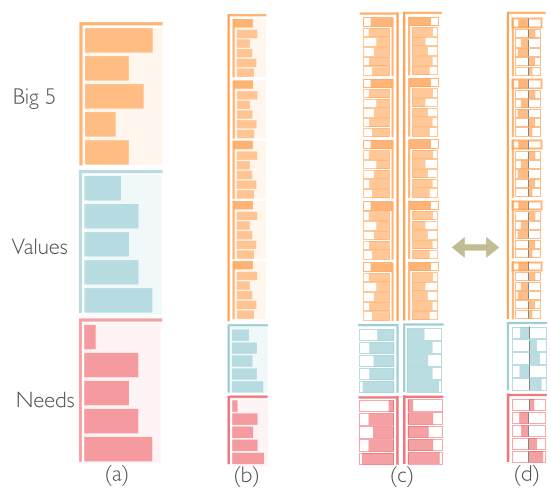 Figure 1: PersonalityGenome Design: (a) Folded, (b) Expanded, (c) Side-by-side, (d) Overlaid.
Experiments & Results
The evaluation focused on whether users could actually use these complex visualizations to gain insights.
- Precision in Detail: Users were nearly perfect (100% accuracy) at retrieving specific values and identifying "extreme" traits (92.3%).
- The "Group Comparison" Hurdle: Accuracy dropped to 57.1% when users were asked to compare entire groups of traits simultaneously. Participants often assumed that a "parent" trait's difference reflected the sub-traits' differences linearly, failing to account for non-uniform weighting.
- User Satisfaction: Users found the system highly engaging, particularly for comparing themselves to role models and celebrities, giving the system a 6.1/7.0 interest score.
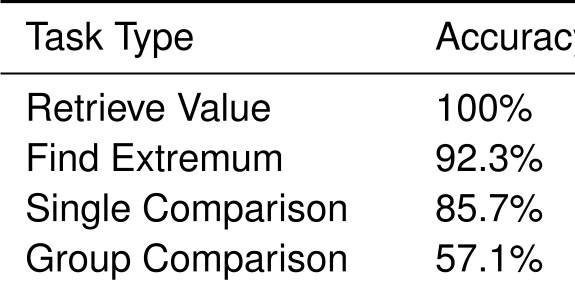 Table 1: Task accuracy demonstrating the difficulty of group-level comparisons.
Critical Analysis & Conclusion
Takeaway: ScopeG proves that personality data is highly "gamifiable" and engaging when translated into the right visual language. The PersonalityGenome provides a robust framework for mobile hierarchical data.
Limitations: The "Group Comparison" failure highlights a critical UX challenge: Inductive Bias. Users instinctively look for simple patterns in hierarchical data. If a system doesn't explicitly visualize how sub-traits contribute to the parent, users will make incorrect assumptions.
Future Outlook: As AI personality modeling becomes more accurate, tools like ScopeG could move beyond "curiosity" and into human resources (team balancing), dating (compatibility), or therapeutic contexts. The next step for this research should be explaining why differences exist by linking traits back to specific social media keywords or behaviors.