
Seeing Sounds: Transcending Text in Musical Social Networks
Seeing sounds: exploring musical social networks.
This paper introduces "Seeing Sounds," a multimedia retrieval framework that visualizes musical social networks using expert-curated artist similarity data. It proposes three interactive presentation styles—2D graphs, Desktop 3D (VRML), and immersive CAVE environments—augmented with spatial audio to provide context-rich search results and navigation.
TL;DR
In "Seeing Sounds," Piotr D. Adamczyk argues that the future of music discovery isn't just a list—it's a landscape. By visualizing musical relationships as dynamic social networks in 2D and 3D space and layering them with spatialized audio, this work provides a blueprint for moving beyond simple text-based search toward immersive "information environments."
The Problem: Lost in the Hyperspace of Music
Have you ever fallen down a "related artists" rabbit hole on a streaming service and completely forgotten how you arrived at a specific experimental jazz band? This is the "lost in hyperspace" phenomenon.
Conventional music retrieval systems (like the AllMusic list-based interface of the early 2000s) struggle with two major issues:
- Context Blindness: Users see what is related, but not why or how central that artist is to a genre.
- Textual Inadequacy: Describing a sound with words is inherently limited. As the author notes, summarizing a career into a single index score is impossible.
Methodology: Social Metrics Meet Spatial Audio
Adamczyk’s team took artist similarity data and mapped it into three distinct interactive modes: 2D interactive graphs, Desktop 3D (VRML), and the CAVE (an immersive VR cube).
1. Visualizing Power and Bridges
To give the nodes meaning, the authors embedded two specific social network metrics:
- Centrality (Prestige): Represented by node size. The larger the text, the more influential the artist is within that specific similarity cluster.
- Betweenness (Bridges): Represented by node shape (rectangle vs. oval). Artists who act as bridges between disparate genres (like DJ Shadow connecting Hip-Hop and Electronica) are visually distinguished.
2. Auralization: Hearing the Data
The most provocative feature is the use of spatial audio. In the 3D and CAVE environments, music clips are localized to the artist's node. As a user moves through the virtual space, they hear a "live mix" that shifts based on their proximity to specific clusters.
 Above: A 3D representation of a musical network using VRML layout.
Experimental Insights: 2D vs. 3D
The study yielded fascinating insights into how we process complex data:
- 2D was King for Clarity: Users found the 2D TouchGraph interface (below) highly efficient for identifying specific artists and seeing the "big picture."
- 3D for Intuition: Despite navigation difficulties, the 3D environments made "distance" feel more real, helping users intuitively grasp stylistic gaps between artists.
- Sound as a Compass: Spatialized audio acted as a "landmark." Even if users didn't know an artist's name, they remembered the "sound" of that corner of the network, which aided navigation tremendously.
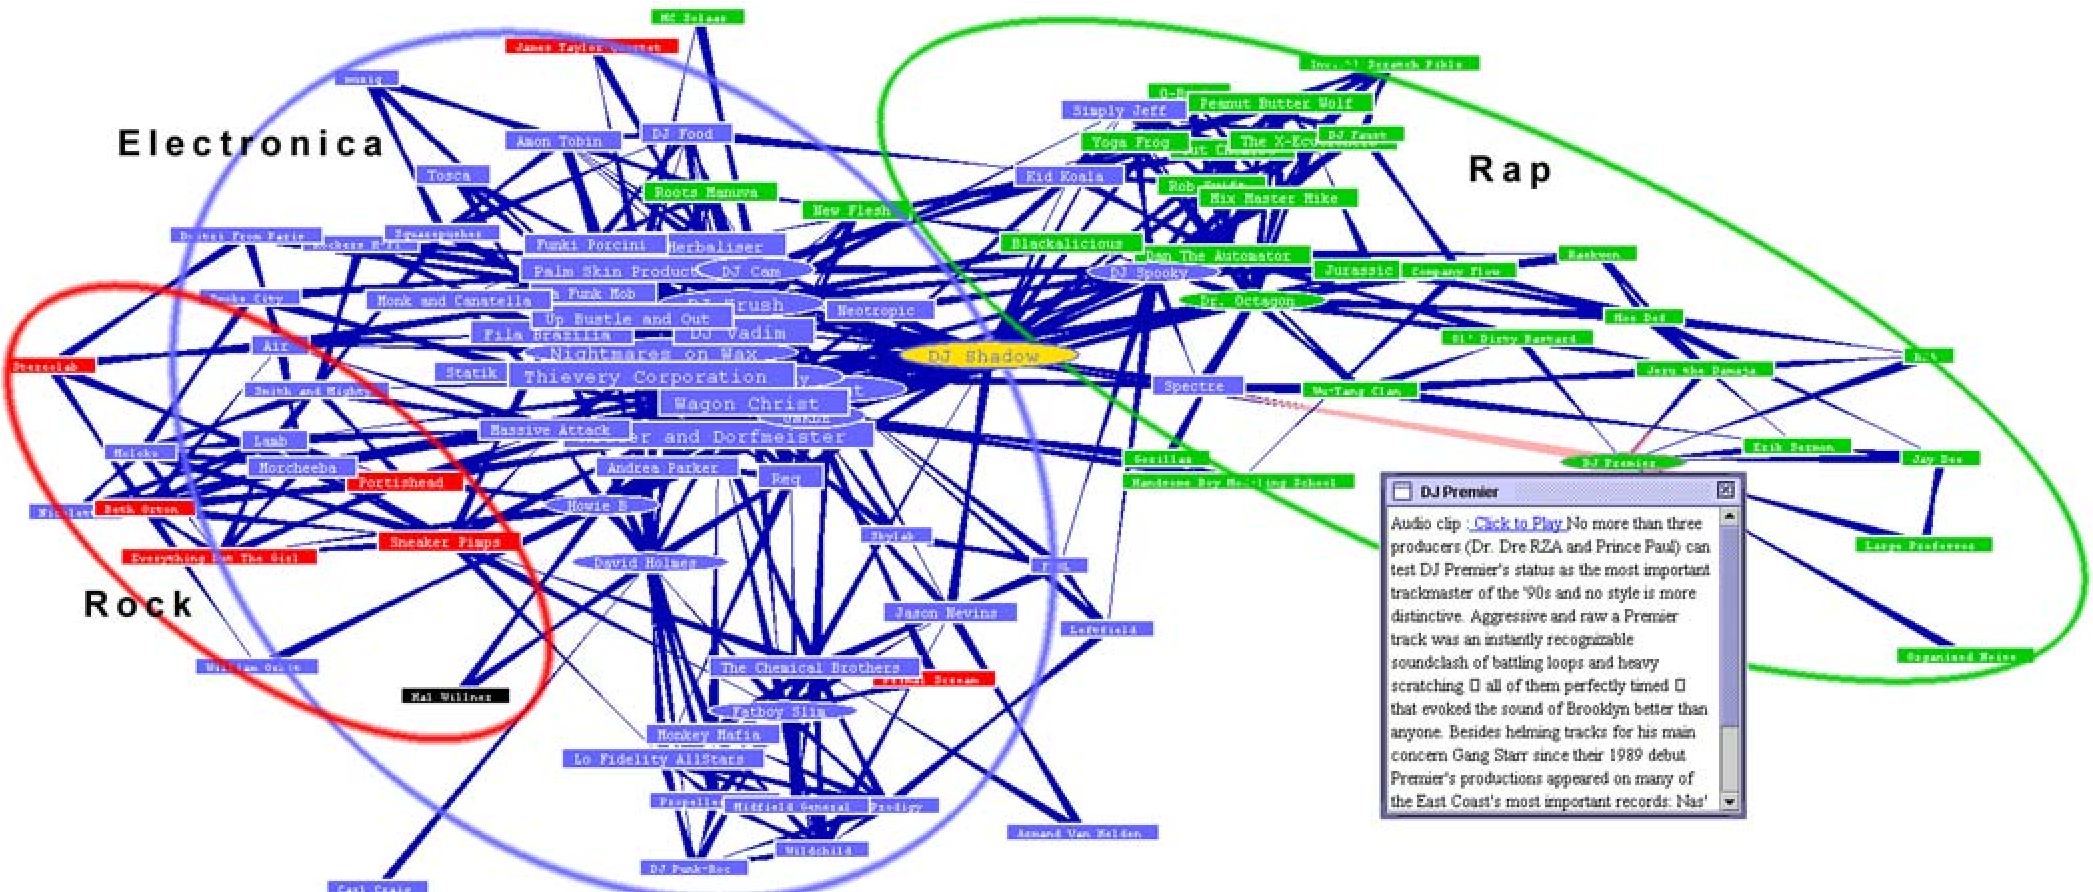 Figure: The 2D TouchGraph interface where clusters are color-coded by genre.
Critical Analysis & The Future
While published in 2004, the implications of "Seeing Sounds" are arguably more relevant today in the era of XR (Extended Reality) and AI-driven recommendations.
Limitations:
- Navigation Friction: The study noted that 3D navigation was "difficult for novice users," a hurdle that modern VR controllers have only partially solved.
- Audio Overload: Too many overlapping tracks can lead to "sonic mud." Finding the right "attenuation radius" for audio in a dense network is a delicate balancing act.
Takeaway: This paper reminds us that information is not just data to be read; it is a space to be inhabited. By combining social network theory with multimedia design, Adamczyk showed that we can "see sounds" and, in doing so, find a better way to navigate the infinite library of human creativity.
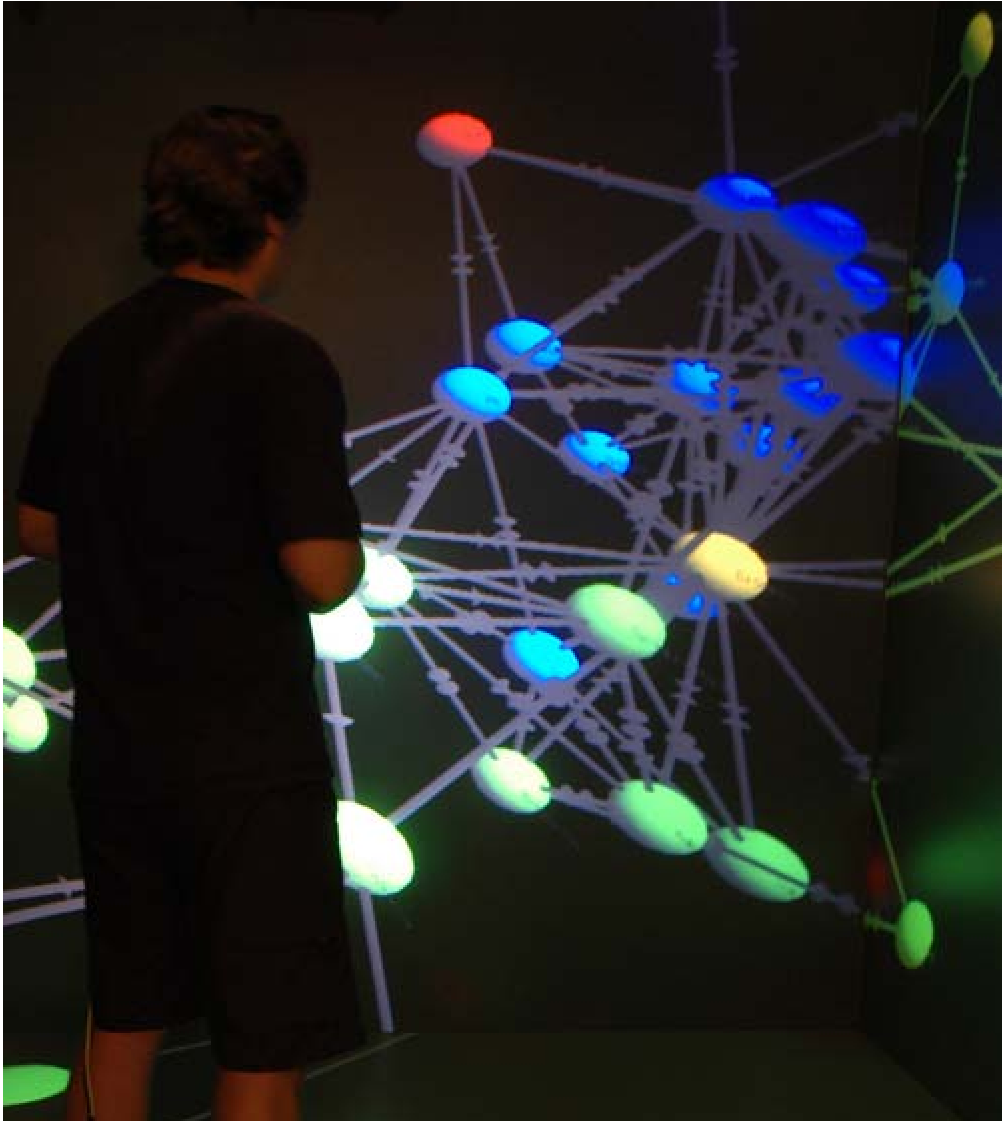 Figure: Seeing music in the CAVE—an immersive Virtual Reality environment.